

 Insee Analyses ·
November 2021 · n° 69
Insee Analyses ·
November 2021 · n° 69 Impact of the health crisis on an anonymised panel of La Banque Postale customers Most customers’ incomes were affected in a limited and temporary manner
Anonymised data on the banking transactions of La Banque Postale customers constitute a complementary source for analysing the impact of the health crisis on the most insecure populations. In 2020, the crisis affected the incomes of most customers in a limited and temporary manner. The sharp fall in spending as a result of health restrictions therefore led to an increase in savings. The proportion of overdrawn customers decreased, especially for the quarter of customers with the lowest income.
However, among the least wealthy customers, populations on the edges of the labour market suffer more. One group is studied specifically: single people with no dependants who are in receipt of the maximum amount of Active Solidarity Income (Revenu de solidarité active – RSA) at the beginning of the year. Their prospects of returning to work have fallen during the health crisis, and thus their earnings in 2020 were lower than those expected by extrapolating the pre-crisis trend. For these customers, the exceptional COVID-19 support paid out in May and November only partially compensated for the loss of income from employment: over the whole of 2020, their incomes were 4% lower than the level expected on the basis of the pre-crisis trend, but without the support, they would have been 7% lower. However, even without the crisis, the majority of RSA recipients at the beginning of the year continued to receive it throughout the year. The difference in mean earnings is therefore explained by the minority of recipients who would have been able to find a job without the crisis.
- Consumption more affected than incomes by health crisis
- Examining financial insecurity using banking data from La Banque Postale
- No rise in overall insecurity indicators in 2020
- Lower incomes, including for the least affluent customers, compared to a “non-crisis trajectory”
- The fall in consumption fuels savings and reduces the proportion of overdrawn customers
- RSA recipients in 2020: fewer returns to work, more social transfers
Consumption more affected than incomes by health crisis
In 2020, in France, expressed in euro at a constant value, GDP shrank by 7.9% and household consumption fell by 7.1% [Insee, 2021]. In order to prevent the COVID-19 health crisis from affecting household incomes despite the usual social protection system (unemployment benefits, minimum social benefits, etc.), the State introduced exceptional support measures for employees (extension of the short-time working scheme, in particular) and households (payment of support to the most insecure). Finally, despite a sharp drop in production and consumption, the disposable income of all households increased by 1.0% and purchasing power per consumption unit remained stable [Insee, 2021]. However, this mean development does not represent the diversity of individual situations. For example, the volumes of food aid distributed by associations would have increased sharply in 2020 and the number of households receiving the RSA rose by 7.4% between the end of December 2019 and the end of December 2020 [Ouvrir dans un nouvel ongletDrees, 2021].
Examining financial insecurity using banking data from La Banque Postale
Banking data from La Banque Postale sheds light on the diversity of financial situations in 2020 (sources). They have the twofold advantage of being able to be used before the tax data are available and of recording monthly changes in income, consumption and wealth. Furthermore, they contain specific information on banking difficulties, such as overdrawn customers. This study uses a panel of 203,000 La Banque Postale customers with accounts active between January 2019 and June 2021. It expands on the results of a study carried out using Crédit Mutuel data [Insee, 2021], with a specific focus on the low income category.
Due to the specific nature of these banking data, the income, spending and wealth studied here do not correspond to the concepts usually used in INSEE publications. Incomes are measured based on incoming cheques and bank transfers. Gross financial wealth corresponds to the total assets across all La Banque Postale accounts (current accounts, savings accounts, life insurance and securities accounts) held by a customer. Spending corresponds to the total amount of card transactions, withdrawals, cheques issued and direct debits. The multidimensional nature of financial insecurity is understood here through three indicators: wealth insecurity, income insecurity and overdraft insecurity.
No rise in overall insecurity indicators in 2020
In this sample of La Banque Postale, customers, incomes rose by an average of 1.5% between 2019 and 2020. All three insecurity indicators were down throughout the entire period under examination, between January 2019 and June 2021 (Chart 1).
While these trends do not differ significantly from those observed at macroeconomic level, they also reflect the specific characteristics of La Banque Postale's customers and the ageing of the sample used. This does not mean, ipso facto, that insecurity was falling in France over the period. Indeed, La Banque Postale's customers are not representative of the population as a whole: in particular, when they are in employment, they are less likely to be managers and more likely to be workers. In addition, given that the panel is composed of the same customers from the beginning of the period to its end, due to the structure of the sample the June 2021 observations correspond to older individuals than those of January 2019, whose incomes may have increased independently of the economic context (because of their seniority in their job, for example). Furthermore, due to the structure of the sample, customers have a higher average length of time with the bank at the end of the period than at the beginning. In particular, this can affect the balances in the accounts.
Lockdowns affect incomes less than savings and wealth. During the first lockdown, health restrictions caused consumption to fall more than income, thereby allowing households to save. Thus, in this particular La Banque Postale, sample, the proportion of customers with less than 3000 euro in their accounts fell by 2 percentage points between March and May 2020 (42% in May). It then rose again slightly once lockdown was lifted, but remained below the pre-crisis level. During this first lockdown, the additional assets in the accounts reduced the proportion of overdrawn customers (-1 percentage point). The less stringent lockdowns in November 2020 and then in March 2021 had more moderate effects than the first: savings, wealth insecurity and the proportion of overdrawn customers per month were stable.
In contrast, the proportion of people with incomes of less than 1000 euro per month increased temporarily, by around 1 percentage point, during the first lockdown, whereas the trend was downwards over the whole period. Furthermore, it did not increase during the subsequent two lockdowns.
tableauChart 1a – Insecurity in the La Banque Postale Customer Panel between January 2019 and June 2021
| Wealth Insecurity: Less than 3000 Euro in their Accounts at the End of the Month |
|
|---|---|
| 2019 | |
| January | 46,5 |
| February | 46,1 |
| March | 45,7 |
| April | 45,9 |
| May | 45,7 |
| June | 45,1 |
| July | 45,6 |
| August | 45,5 |
| September | 45,8 |
| October | 45,9 |
| November | 45,2 |
| Décember | 45,4 |
| 2020 | |
| January | 45,2 |
| February | 44,8 |
| March | 44,2 |
| April | 42,6 |
| May | 41,6 |
| June | 41,7 |
| July | 41,8 |
| August | 42,1 |
| September | 42,2 |
| October | 42,5 |
| November | 41,6 |
| Décember | 41,5 |
| 2021 | |
| January | 41,2 |
| February | 40,7 |
| March | 40,9 |
| April | 40,6 |
| May | 40,7 |
| June | 40,6 |
- Reading note: in late March 2020, 44.2% of customers have less than 3000 euro in their accounts (wealth insecurity).
- Coverage: France, sample of La Banque Postale main bank account customers present over the entire period of January 2019-June 2021 after filtering out inactive accounts.
- Sources: La Banque Postale; INSEE: authors’ calculations.
graphiqueChart 1a – Insecurity in the La Banque Postale Customer Panel between January 2019 and June 2021

- Reading note: in late March 2020, 44.2% of customers have less than 3000 euro in their accounts (wealth insecurity).
- Coverage: France, sample of La Banque Postale main bank account customers present over the entire period of January 2019-June 2021 after filtering out inactive accounts.
- Sources: La Banque Postale; INSEE: authors’ calculations.
Lower incomes, including for the least affluent customers, compared to a “non-crisis trajectory”
The panel of La Banque Postale customers makes it possible to measure the impact of the health crisis by comparing the trajectory of customers in 2020 with that expected if the pre-crisis trend of 2019 had continued (methods).
Using this method, incomes for the entirety of 2020 appear to be 2% lower than the expected “non-crisis” level, while spending was 6% lower. During the first lockdown from March to May 2020, spending and incomes were far below their level expected by extrapolating the pre-crisis trend (Chart 2). In April, spending was down 34% and incomes were down 10%. Outside this period, spending and incomes in 2020 were close to expected levels. The November lockdown had a much smaller impact on both spending and incomes.
Compared to the expected level, the shortfall in income during lockdown was somewhat greater and more persistent for the most insecure customers than for other groups. For the quarter of customers with the lowest incomes at the beginning of 2020, their average income was lower each month than that expected by extrapolating the pre-crisis trend; only November, the month in which exceptional support was paid to the most insecure customers, is an exception. For the year as a whole, this group’s incomes were 3% below the level expected.
tableauChart 2a – Differences in Monthly Spending and Income in 2020 Compared with the Simulated Non-Crisis Level, Based on Income in January 2020
| Spending | Income | |
|---|---|---|
| January | 0,0 | 0,0 |
| February | – 1,3 | – 0,9 |
| March | – 10,1 | – 2,6 |
| April | – 33,2 | – 12,4 |
| May | – 14,7 | – 7,0 |
| June | 5,8 | – 0,8 |
| July | – 5,8 | – 7,6 |
| August | – 0,8 | – 1,1 |
| September | – 5,9 | – 1,4 |
| October | – 2,9 | – 2,4 |
| November | – 4,2 | 2,9 |
| Décember | – 3,5 | – 5,4 |
- Reading note: in April 2020, the quarter of customers with the lowest incomes in January have spending 33% below the level expected if the pre-crisis trend had continued.
- Coverage: France, sample of La Banque Postale main bank account customers present over the entire period of January 2019-June 2021 after filtering out inactive accounts.
- Sources: La Banque Postale; INSEE: authors’ calculations.
graphiqueChart 2a – Differences in Monthly Spending and Income in 2020 Compared with the Simulated Non-Crisis Level, Based on Income in January 2020
- Reading note: in April 2020, the quarter of customers with the lowest incomes in January have spending 33% below the level expected if the pre-crisis trend had continued.
- Coverage: France, sample of La Banque Postale main bank account customers present over the entire period of January 2019-June 2021 after filtering out inactive accounts.
- Sources: La Banque Postale; INSEE: authors’ calculations.
The fall in consumption fuels savings and reduces the proportion of overdrawn customers
The reduction in spending during the first lockdown encouraged saving: it thus reduced wealth insecurity and the proportion of overdrawn customers. In December 2020, the gross financial wealth of the quarter of customers with the lowest incomes at the beginning of the year was 360 euro higher than expected, compared with 1200 euro for the quarter of customers with the highest incomes. It is therefore those with high incomes who have saved more and added to their financial wealth [Insee, 2021].
The proportion of overdrawn customers was also below the level expected (-2 percentage points). The effect was stronger for those low incomes (-3 percentage points), as it was rarer for those with high incomes to be in this situation, regardless of the year considered. These results may appear to differ from those obtained from surveys. Thus, in the Epicov survey, a quarter of people report that their financial situation had deteriorated during the crisis and the lower the household’s standard of living at the outset, the higher this proportion [Givord, Silhol, 2020].
However, the perception of a deteriorating financial situation does not necessarily translate into a fall in the balances held in household bank accounts. If their incomes from work fall and the economic outlook darkens, households may see their financial situation as deteriorating even if their ability to save improves temporarily. Furthermore, the monthly consumer confidence (CAMME) survey shows that the proportion of households reporting that they are in debt or drawing on their reserves decreased in 2020, regardless of the standard of living [Clerc, Legleye, Nougaret, 2021].
RSA recipients in 2020: fewer returns to work, more social transfers
In 2020, some of the most insecure and low-skilled jobs suffered more than others due to the crisis. Some people lost their jobs while others, who were inactive or unemployed before the crisis, have not been able to find a job.
Exceptional financial support was paid out in May and November to compensate for the increase in insecurity due to this fall in employment. La Banque Postale banking data makes it possible to measure the capacity of such support to prevent the deterioration of the situation of certain populations. The analysis focuses on single people, without dependants, in receipt of the maximum lump sum in January or February 2020 (at the end of 2019, single people without dependants represented 55% of RSA recipients [Ouvrir dans un nouvel ongletDrees, 2021]).
Over the whole of 2020, the incomes of these recipients were 4% lower (7% without support) than the level expected based on the pre-crisis trend (Chart 3). In particular, they were below the expected level in every month of the year, with the exception of May and November, when exceptional support was paid out. This phenomenon is likely due to returns to work being less common for those customers who were RSA recipients at the beginning of the year. In order to estimate the proportion of returns to work, the proportion of customers whose main source of income was no longer family allowance (caisse d’allocations familiales – CAF) benefit payments was calculated monthly (methods). In both 2019 and 2020, this proportion increased as people return to work throughout the year (Chart 4). However, in 2020, this increase diminishes from the first lockdown onwards. At the end of 2020, this proportion was 4 percentage points lower than in 2019. These results reflect the fall in the number of people who stop receiving RSA payments, which explains the increase in the number of recipients in 2020 [Ouvrir dans un nouvel ongletCnaf, 2020].
In 2020, while the average income of the RSA recipients studied was below the expected level, the median is identical to the expected level, except in May and November when it was higher. The majority of the RSA recipients studied did not experience a drop in income. In fact, as the majority of them were unable to find a job (in both 2019 and 2020), their incomes depended exclusively on social transfers, which did not fall in 2020, but increased as a result of the exceptional support. Furthermore, overdrawn customers are not more common, likely for the same reason, as well as because of the restrictions on consumption experienced during the lockdowns. Finally, these RSA recipients, whose spending mainly relates to basic necessities, reduced their consumption more slowly in 2020 than the rest of the sample.
tableauChart 3 – Differences in monthly income in 2020 compared with the simulated non-crisis level, for some RSA recipients at the start of the year
| Mean | Mean excluding exceptional support |
Median | Median excluding exceptional support |
|
|---|---|---|---|---|
| January | 0,0 | 0,0 | 0,0 | 0,0 |
| February | – 1,5 | – 1,5 | 0,0 | 0,0 |
| March | – 8,2 | – 8,2 | 0,0 | 0,0 |
| April | – 9,2 | – 9,2 | 0,0 | 0,0 |
| May | 4,9 | – 11,6 | 30,5 | 0,0 |
| June | – 9,3 | – 9,3 | – 0,2 | – 0,2 |
| July | – 13,1 | – 13,1 | – 0,5 | – 0,5 |
| August | – 7,3 | – 7,3 | – 0,7 | – 0,7 |
| September | – 6,1 | – 6,1 | – 0,7 | – 0,7 |
| October | – 5,0 | – 5,0 | – 0,7 | – 0,7 |
| November | 13,7 | – 1,6 | 29,3 | – 0,7 |
| Décember | – 7,2 | – 7,2 | – 0,9 | – 0,9 |
- Notes: income “excluding exceptional support” excludes the exceptional support provided in May ad November 2020.
- Reading note: in April 2020, customers who were single, without dependants and in receipt of the maximum amount of RSA at the beginning of the year (January or February) have incomes that are on average 9% lower than expected if the pre-crisis trend had continued.
- Coverage: France, sample of La Banque Postale main bank account customers present over the period of January 2019-June 2021 who are single, without dependants and in receipt of the maximum amount of RSA (with or without housing benefit) at the beginning of the year (in January or February).
- Sources: La Banque Postale; INSEE: authors’ calculations.
graphiqueChart 3 – Differences in monthly income in 2020 compared with the simulated non-crisis level, for some RSA recipients at the start of the year
- Notes: income “excluding exceptional support” excludes the exceptional support provided in May ad November 2020.
- Reading note: in April 2020, customers who were single, without dependants and in receipt of the maximum amount of RSA at the beginning of the year (January or February) have incomes that are on average 9% lower than expected if the pre-crisis trend had continued.
- Coverage: France, sample of La Banque Postale main bank account customers present over the period of January 2019-June 2021 who are single, without dependants and in receipt of the maximum amount of RSA (with or without housing benefit) at the beginning of the year (in January or February).
- Sources: La Banque Postale; INSEE: authors’ calculations.
tableauChart 4 – Share of some RSA recipients at the beginning of the year for whom CAF benefits are no longer the main source of income
| 2019 | 2020 | |
|---|---|---|
| January | 4,3 | 2,8 |
| February | 4,1 | 3,9 |
| March | 6,7 | 6,5 |
| April | 9,8 | 8,3 |
| May | 11,8 | 8,5 |
| June | 15,8 | 10,6 |
| July | 19,8 | 15,9 |
| August | 18,2 | 14,3 |
| September | 18,7 | 13,8 |
| October | 17,6 | 13,7 |
| November | 18,6 | 15,1 |
| Décember | 20,0 | 15,8 |
- Reading note: in May 2020, CAF benefits are no longer the main source of income for 8.5% of people who were single, without dependants and in receipt of the maximum amount of RSA in January or February.
- Coverage: France, sample of La Banque Postale main bank account customers present over the period of January 2019-June 2021 who are single, without dependants and in receipt of the maximum amount of RSA (with or without housing benefit) at the beginning of the year (in January or February).
- Sources: La Banque Postale; INSEE: authors’ calculations.
graphiqueChart 4 – Share of some RSA recipients at the beginning of the year for whom CAF benefits are no longer the main source of income
- Reading note: in May 2020, CAF benefits are no longer the main source of income for 8.5% of people who were single, without dependants and in receipt of the maximum amount of RSA in January or February.
- Coverage: France, sample of La Banque Postale main bank account customers present over the period of January 2019-June 2021 who are single, without dependants and in receipt of the maximum amount of RSA (with or without housing benefit) at the beginning of the year (in January or February).
- Sources: La Banque Postale; INSEE: authors’ calculations.
Sources
Data Access and Use
INSEE would like to thank La Banque Postale or its support and for allowing it to access its data in a secure framework that guarantees the anonymity of its customers, as well as the Council of Economic Analysis (Conseil d’Analyse Économique – CAE) and the Directorate-General of the Treasury (Direction Générale du Trésor – DGT) for their comments. The processing that made it possible to construct this sample was carried out by La Banque Postale on its own secure IT systems. Access to the sample data was provided through the Secure Access Data Centre (Centre d’accès sécurisé aux données – CASD).
The sample provided by La Banque Postale is an anonymised panel of 300,000 customers for whom La Banque Postale has been the main bank for at least one month between January 2019 and December 2020. If they remain with the bank, the sampled customers are monitored until June 2021. The data contain end-of-month account balances (individual current accounts and joint accounts, savings accounts and securities accounts), all transactions carried out (amounts and dates of card transactions, cheques, transfers, direct debits, withdrawals and deposits) and some socio-demographic data (age, gender, department of France, etc.). The sample constructed by La Banque Postale is stratified by age and by department.
Study Limitations Linked to the Data
Banking data is rich in information; however, it does have a certain number of limitations:
- non-representativeness: the sample excludes individuals without bank accounts. In addition, La Banque Postale customers are on average more insecure than customers of other banks. There are fewer managers and more workers. This prevents the results of the study from being extrapolated to all individuals with bank accounts. This is, however, an advantage for studying the most disadvantaged populations. Furthermore, the sample contains almost no customers under 20 years of age. Finally, any informal income not deposited in bank accounts is by definition not taken into account;
- use of multiple banks: people may have accounts with other financial institutions. Within the sample, La Banque Postale has selected only customers that it identifies as having their main bank account with La Banque Postale. Despite this selection, this leads to an underestimation of household savings. However, the problem is probably less acute for people on low incomes;
- the lack of household information: banking information is provided at individual level, not at household level. An analysis by consumption units is therefore impossible. Bank accounts of any other members of the household are not observed, even if their accounts are also held with La Banque Postale. If the customer has a joint account, all transactions and amounts relating to that account are divided by the total number of account holders;
- inactive accounts: some accounts are inactive (less than 150 euro of spending or income over three consecutive months). The number of inactive accounts increases over the period. One third of the observations are removed due to this criterion.
Construction of the Final Sample
In order to avoid bias due to the increase in the number of inactive accounts over
the period, only customers who spend (via cards, withdrawals and direct debits) and
receive more than 150 euro for three consecutive months on a rolling basis are retained
in the study. Of the 300,000 customers considered for the sample, only 203,000 customers
who are present continuously from January 2019 to June 2021 are retained. The sample
is weighted based on the population census by five-year age bracket and department
to better represent the general structure of the French population. However, this
operation is not sufficient for the sample to be representative of the French population.
Méthodes
Comparing the 2020 and 2019 Trajectories
In order to identify the impact of the health crisis on spending or incomes, it is necessary to estimate the difference between the values observed in 2020 and the expected values, had the pre-crisis trend continued. In 2020, the predicted level in a given month is equal to the level of the same month in 2019 multiplied by the annual growth rate between January 2019 and January 2020 (before the health crisis). Thus, for a variable Y, the relative difference between the observed level and the expected level is equal to:
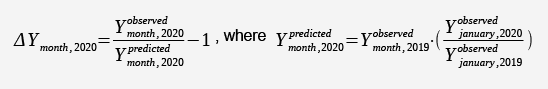
A -0.1 difference in incomes in April 2020 means that customers received, on average,
10% less income in April 2020 than expected based on extrapolating the pre-crisis
trend.
The quality of this measurement relies on the validity of the assumption that developments in 2019 and 2020 would have been similar in the absence of a crisis. By definition, the counter-factual levels, i.e. those that would have prevailed in 2020 in the absence of the crisis, are unknown and this assumption cannot be tested except in relation to February 2020. Indeed, as of this date, the crisis has not yet broken out: if the assumption is valid, the differences between the observed values and the predicted values should be small for this month, which is the case (Chart 2, Chart 3).
Creation of Income Groups at the Start of the Year
Each year, the sample is divided into four groups defined on the basis of the income quartiles observed in January.
| 2019 | 2020 | |
|---|---|---|
| Quartile 1 | 880 | 940 |
| Median | 1 390 | 1 460 |
| Quartile 3 | 2 010 | 2 070 |
Using a single month of incomes (in this case, January) does not provide a reliable measurement of customers’ incomes. For example, well-off customers may be classed in the low-income group if their incomes are exceptionally low in that specific month. To limit this bias, observations for which consumption in January is more than two standard deviations away from the mean are discarded. In addition, customers receiving less than the maximum RSA lump sum for a single person in that month are also excluded.
Identifying Customers in Receipt of RSA and Their Returns to Work
RSA recipients are identified in the data if they receive a transfer in January or February corresponding to the maximum lump sum (with or without housing benefit) to the nearest cent. Returns to work are not directly observed in the data used. They are estimated based on the proportion of customers for whom CAF benefit payments are not their main source of income. This corresponds to the proportion of customers who do not receive the majority of their income on the day on which RSA payments are made (usually the 5th of each month).
Définitions
Monthly incomes are measured based on the sum of incoming transfers and cheques in amounts less than 40.000 euro. Round figures are not taken into account, aside from the exceptional support paid out in May and November (unless otherwise stated). For example, an amount of 500.00 euro is not taken into account, while an amount of 500.13 euro is. Indeed, these round figures likely correspond to transfers between accounts, rather than to income. Incoming flows entering a joint account are individualised, i.e. divided by the number of account holders (usually two).
A customer’s gross financial wealth is the sum of all the assets in their accounts, excluding debts and loans: (individual and joint) current accounts, savings accounts, life insurance and securities accounts.
Monthly spending is the sum of card spending, withdrawals (at ATMs or over-the-counter), outgoing cheques and direct debits.
The income insecurity indicator is equal to the share of customers with monthly incomes of less than 1.000 euro.
The wealth insecurity indicator is the share of customers with less than 3.000 euro in total assets at the end of the month.
The overdraft insecurity indicator is equal to the share of customers over their authorised overdraft for at least five days in a given month.
If we place the distribution of incomes in order, the median income shares this distribution into two parts of equal size. Thus, 50% of the sample earns more and 50% earns less.
The exceptional support included in the monthly incomes is the support paid out in May and November 2020: 150 euro (+100 euro per dependent child under 20 years of age) granted in particular to those in receipt of RSA and to those in receipt of the Specific Solidarity Allowance (Allocation de solidarité spécifique – ASS).
Buresi G., Cornuet F., « Estimation avancée du taux de pauvreté monétaire et des indicateurs d’inégalités - En 2020, les inégalités et le taux de pauvreté monétaire seraient stables », Insee Analyses n° 70, novembre 2021.
Drees, « Ouvrir dans un nouvel ongletMinima sociaux et prestations sociales - Ménages aux revenus modestes et redistribution », Panoramas de la Drees, septembre 2021.
Insee, Drees, « Aide alimentaire : une hausse prononcée des volumes distribués par les associations en 2020 », Communiqués de presse, juillet 2021.
Clerc M., Legleye S., Nougaret A., « Au premier trimestre 2021, 22 % des ménages déclarent une baisse de revenus par rapport à mars 2020 », Insee Focus n° 238, mai 2021.
Amoureux V., Héam J.-C., Laurent T., « Les comptes de la Nation en 2020 - Baisse historique du PIB, mais résilience du pouvoir d’achat des ménages », Insee Première n° 1860, mai 2021.
Insee, « En 2020, la chute de la consommation a alimenté l’épargne, faisant progresser notamment les hauts patrimoines financiers : quelques résultats de l’exploitation de données bancaires », Note de conjoncture, mars 2021.
Cnaf, « Ouvrir dans un nouvel ongletEstimations avancées des évolutions des foyers allocataires du RSA », Rsa conjoncture n° 31, supplément exceptionnel lié à la Covid-19, novembre 2020.
Conseil d’Analyse Économique, « Ouvrir dans un nouvel ongletDynamiques de consommation dans la crise : les enseignements en temps réel des données bancaires », Focus n° 49, 2020.
Givord P., Silhol J., « Confinement : des conséquences économiques inégales selon les ménages », Insee Première n° 1822, octobre 2020.
Demoly E., Schweitzer C., « Les ménages les plus modestes dépensent davantage pour leur logement et les plus aisés pour les transports », Insee Focus n° 203, septembre 2020.
Haveman R., Wolff E.-N., “The concept and measurement of asset poverty: Levels, trends and composition for the US, 1983–2001”, The Journal of Economic Inequality, 2(2), 145-169., 2004.