

Growth, Games and unknown factors Economic Outlook - July 2024
Focus – A “Paris Olympics effect” on growth of around 0.3 GDP points in Q3
Julie Kiren, Mathilde Niay, Guillaume Roulleau
The Olympic and Paralympic Games are among the major sporting events likely to generate a significant economic impact for the host country. According to the literature, activity, where it exists, can be boosted through several channels. Capital expenditure prior to the event benefits the construction sector, and during the competition, the influx of visitors generates increased demand in the service sectors, particularly those linked to tourism (accommodation, food services, transport, etc.). However, the extent of these effects is open to debate: they may prove to be relatively small in countries that are already highly attractive to tourists, due to crowding-out effects.
The London 2012 Olympic and Paralympic Games provide a relevant basis of comparison for analysing the possible economic impacts of this summer's Olympics in Paris on the French economy. In Q3 2012, the United Kingdom recorded actual GDP growth of 1.0%. The Olympic and Paralympic Games are estimated to have contributed between +0.2 and +0.4 points to this growth, depending on the available sources.
The situation in France is likely to be quite similar in the summer of 2024. Although the increase in activity due to infrastructure construction is already largely behind us, sales of tickets and audiovisual broadcasting rights are expected to contribute 0.25 points to growth in Q3 2024. The knock-on effects in other tourism sectors are more uncertain, but could boost growth by up to an additional 0.05 points. This support is expected to be non-recurring, disappearing at the end of the year and leading to a sharp slowdown in activity in Q4.
Conjoncture in France
Paru le :17/07/2024
- There is no consensus in the literature on whether the organisation of major sporting events has a positive impact on the host country's economic activity
- The London Olympic and Paralympic Games provide a frame of reference for anticipating the effects of Paris 2024
- The effects on the construction industry were expected to materialise in the UK in 2010 and 2011
- UK growth bounced back strongly in Q3 2012, with the London Games contributing between 0.2 and 0.4 percentage points
- Most of this effect would appear to have been channelled through ticket sales...
- ... with more uncertain impacts on tourism due to strong crowding-out effects
- The impact of the Paris Olympic and Paralympic Games on economic activity in the summer is expected to be around +0.3 GDP points, as in London in 2012
- Some of these positive effects have already been seen, notably in the construction sector
- Ticket sales and broadcasting revenues have a direct positive effect on activity
- In the spring, accommodation and food-service companies in the Île-de-France region were optimistic about their three-month business expectations, pointing towards an “OPG” effect in the sector
- Transport consumption is set to rise sharply compared with a normal summer
- Bonuses paid to civil servants reflect an increase in the production of non-market services
- Other effects, of limited scope, could appear
- Economic impact assessment of the Paris 2024 Olympic Games
There is no consensus in the literature on whether the organisation of major sporting events has a positive impact on the host country's economic activity
The impacts of organising major events such as the Olympic and Paralympic Games (OPG) on a country's economic activity are likely to be felt over several years, especially in the run-up to the Games and during the sporting events themselves. Different types of effects are observed. The build-up to the Games is often marked by the construction of infrastructure and preliminary expenditure linked to the organisation. The period when the Games are actually held is marked by the income generated by tourism. Finally, the impact of the Games after they have been staged is reflected by the legacy effects (long-term use of infrastructure) and the long-term enhancement of tourist appeal. The enduring impact of the economic effects depends mainly on the use of the resources generated after the Games, even though many of the benefits are temporary. For example, C. Vierhaus, 2018 estimates that promotion of tourism linked to the organisation of the Summer Olympic Games considerably increases international tourist arrivals in the eight years preceding and for twenty years after the event.
However, there is no consensus in the literature on the extent of the impact, even transitory, on the host country's overall economy. These positive effects may also be relatively weak in countries that are already highly attractive to tourists, as these countries benefit less from the tourism promotion effect generated by the sporting event: according to I. Drapkin, S. Ivan, Z. Ilya, 2023, events organised in the United States and Europe (two already popular tourist destinations in normal times) will not have a net positive effect on tourism, in contrast to those organised in Asia or Africa. The problems caused caused by these major events (saturated infrastructures, overcrowding, higher accommodation costs, etc.) makes them less attractive to ordinary tourists. This crowding-out effect could cause the sporting event to have mixed effects on tourism in the short term. According to these authors, of the major sporting events organised between 1995 and 2019, only the Football World Cups organised by Japan and Korea in 2002 and by South Africa in 2010 have led to a significant increase in tourist arrivals in the host countries.
In 1976, the International Olympic Committee stressed the need to develop objective analyses to assess the ex ante impacts of the Games and the obligation for countries to present them in their candidature files. These studies are regularly criticised for tending to greatly overestimate the positive effects of the Games while underestimating the costs (H. Preuss, 2005): over time, the studies reveal increasingly modest results. For example, the ex ante analysis report on the London Olympic Games, commissioned by the UK Department for Culture, Media and Sport (A. Blake, 2005), points out that the studies often downplay negative consequences such as the crowding-out effects on ordinary tourists.
The London Olympic and Paralympic Games provide a frame of reference for anticipating the effects of Paris 2024
The London 2012 Olympic and Paralympic Games provide a relevant basis of comparison for analysing the possible economic impacts of this summer's Olympics in Paris on the French economy, as this was a relatively recent event, organised by a city with similar characteristics: London and Paris are two major European capitals with highly developed economies, tourism industries and established urban infrastructures. Comparisons with the editions organised by Rio de Janeiro in 2016 and Tokyo in 2021 (during the COVID pandemic) appear to be less relevant.
Several studies have assessed the contribution of the London Games to the UK economy. The budget amounted to $14.9 billion, corresponding to an overrun of approximately 76% (Flyvbjerg et al., 2016), making the London Games one of the most expensive in history, alongside Beijing (2008) and Sydney (2000).
Ex ante assessments were carried out. The study carried out in A.Blake, 2005, estimated that the Games would increase the UK's GDP by £1.9 billion over the 2005-2016 period compared with a counterfactual scenario in which the Games were not staged. Around half of these gains were expected to be realised in 2012 (£0.2 bn before the event, £1.1 bn in 2012 and £0.6 bn afterwards). The impact on annual UK growth in 2012 was therefore estimated, ex ante, at around +0.1 points (or +0.3 points based on growth in Q3 2012). The Economic and Social Sciences Research Council also proposed an initial status report (ESRC, 2008), which listed a panel of environmental, economic and social indicators devised ex ante to measure the impact of the Games. In this context, the UK's national statistical institute – the Office for National Statistics (ONS) – had produced a report setting out how the effect of the Games (construction and infrastructure, ticket sales, television rights, sponsorship and advertising, athletes' travel and tourism) could be recorded in the national accounts, but without quantifying the overall impact (ONS 2012). The institute had identified various categories as being accounting measurement issues, based on previous experience of the Sydney Games in 2000 and reports from the Australian Bureau of Statistics (ABS).
The effects on the construction industry were expected to materialise in the UK in 2010 and 2011
Some of the positive effects of the London Games were realised in the run-up to the event. This is applies to the construction projects completed before the start of the Olympic and Paralympic Games, whose economic impact had already been recorded in the UK national accounts by the ONS (ONS, 2012) via estimates of output in the construction sector on the resources side, and in gross fixed capital formation on the use side.
As a result, activity in the construction sector started ramping up significantly in the UK at the start of 2010. While it is difficult to distinguish precisely between the effect of the London Olympics and the automatic rebound from the financial crisis, the high levels of activity attained towards the end of 2011 are compatible with the timetable for the organisation of the Games. Similarly, activity in this sector in the UK contracted by almost 10% in Q1 and Q2 2012: this decline may have been be linked to the end of construction work for the Games (Bank of England, Inflation Report, 2012), although other production constraints may also have come into play, such as the weather and the Queen's Jubilee.
UK growth bounced back strongly in Q3 2012, with the London Games contributing between 0.2 and 0.4 percentage points
With regard to the organisation of the event itself, the UK saw real GDP growth of +1.0% in Q3 2012, one of the highest values attained in the 2010s (Figure 1). However, this result was not entirely due to the organisation of the Olympic and Paralympic Games. Activity bounced back automatically after Q2 2012 and the Queen's Jubilee festivities, for which an additional public holiday, not accounted for in the ONS working day adjustment, had been granted. According to M. Hardie et F. Perry, May 2013, the Jubilee is estimated to have cost between 0.3 and 0.4 points of GDP in Q2, and to have made a positive contribution of a similar magnitude to growth in Q3.
tableauFigure 1 – Quarterly GDP growth in the United Kingdom during the 2010s(quarterly changes in %)
| date | GDP |
|---|---|
| 01/01/2008 | 0.48 |
| 01/04/2008 | -0.48 |
| 01/07/2008 | -1.54 |
| 01/10/2008 | -2.12 |
| 01/01/2009 | -2.04 |
| 01/04/2009 | -0.32 |
| 01/07/2009 | 0.06 |
| 01/10/2009 | 0.29 |
| 01/01/2010 | 0.93 |
| 01/04/2010 | 1.08 |
| 01/07/2010 | 0.55 |
| 01/10/2010 | 0.08 |
| 01/01/2011 | 0.25 |
| 01/04/2011 | 0.11 |
| 01/07/2011 | 0.30 |
| 01/10/2011 | 0.13 |
| 01/01/2012 | 0.87 |
| 01/04/2012 | -0.13 |
| 01/07/2012 | 0.95 |
| 01/10/2012 | -0.11 |
| 01/01/2013 | 0.28 |
| 01/04/2013 | 0.72 |
| 01/07/2013 | 0.83 |
| 01/10/2013 | 0.70 |
| 01/01/2014 | 0.82 |
| 01/04/2014 | 0.87 |
| 01/07/2014 | 0.75 |
| 01/10/2014 | 0.70 |
| 01/01/2015 | 0.29 |
| 01/04/2015 | 0.58 |
| 01/07/2015 | 0.39 |
| 01/10/2015 | 0.57 |
| 01/01/2016 | 0.36 |
| 01/04/2016 | 0.56 |
| 01/07/2016 | 0.37 |
| 01/10/2016 | 0.63 |
| 01/01/2017 | 0.84 |
| 01/04/2017 | 0.64 |
| 01/07/2017 | 0.63 |
| 01/10/2017 | 0.72 |
| 01/01/2018 | 0.06 |
| 01/04/2018 | 0.16 |
| 01/07/2018 | 0.33 |
| 01/10/2018 | 0.12 |
| 01/01/2019 | 0.72 |
- Source: ONS.
graphiqueFigure 1 – Quarterly GDP growth in the United Kingdom during the 2010s(quarterly changes in %)

- Source: ONS.
Most of this effect would appear to have been channelled through ticket sales...
The most easily quantifiable impact of the London Olympic and Paralympic Games on business was the revenue generated by ticket sales. Although the majority of tickets were sold in Q2 2011, the ONS recorded this expenditure in the UK National Accounts in Q3 2012, when spectators actually attended the Olympic events (Figure 2). Most of this expenditure was recorded as final household consumption expenditure (ONS, 2012). M.Hardie et F.Perry, 2013 estimate that this effect represented a 0.2 point increase in GDP growth in Q3, amounting to around £0.6 bn. This was reflected in an increase in the production of recreational services of around 25% between June and August 2012, an aspect which faded away completely in the following months.
tableauFigure 2 – Output in the sports, recreation and leisure sector and in services as a whole in the UK(in base 100 = 2009)
| date | Arts, entertainment and recreation | Index of services |
|---|---|---|
| 01-11 | 103.6 | 100.9 |
| 02-11 | 103.7 | 101.6 |
| 03-11 | 106.2 | 102.6 |
| 04-11 | 104.6 | 101 |
| 05-11 | 106.3 | 102.6 |
| 06-11 | 105.9 | 102.3 |
| 07-11 | 103.2 | 103 |
| 08-11 | 104 | 102.5 |
| 09-11 | 105.4 | 102.8 |
| 10-12 | 104.2 | 102.1 |
| 11-12 | 103.6 | 103 |
| 12-12 | 105.4 | 103.1 |
| 01-12 | 107 | 103.2 |
| 02-12 | 105.8 | 102.7 |
| 03-12 | 107.2 | 103.4 |
| 04-12 | 105.2 | 102.8 |
| 05-12 | 105.9 | 103.6 |
| 06-12 | 108.3 | 102.2 |
| 07-12 | 119.6 | 103.6 |
| 08-12 | 133.4 | 104.6 |
| 09-12 | 117.3 | 104 |
| 10-12 | 110.7 | 104.2 |
| 11-12 | 109.8 | 104.2 |
| 12-12 | 107 | 103.7 |
| 01-13 | 106.1 | 104 |
| 02-13 | 108.3 | 104.9 |
- Source: ONS.
graphiqueFigure 2 – Output in the sports, recreation and leisure sector and in services as a whole in the UK(in base 100 = 2009)
- Source: ONS.
... with more uncertain impacts on tourism due to strong crowding-out effects
The London Olympic and Paralympic Games are also likely to have affected tourism, but these effects were probably much more diffuse: in order to meet the analytical requirements, the ONS extended its International Passenger Survey (IPS) sample in 2012 to provide information on foreign visitors and their associated spending. For example, according to the ONS, the number of visits to the UK in 2012 compared with 2011 fell in Q3 and increased in the other quarters of the year (Figure 4.b, and ONS 2012). In terms of visitor numbers, the London OPG Games therefore had a very strong crowding-out effect (greater than 1). According to the “Visitor Attraction Monitor” survey by London and Partners, London's main attractions recorded a sharp decline in visitor numbers in the summer of 2012 (London Tourism Report 2012/13 and 2013/14): notable examples were the British Museum, the National Gallery and the Natural History Museum, where visitor numbers fell by 24%, 28% and 7% respectively year on year in July/August 2012 (M. Delaplace, A. Schaffar, 2022 and Figure 3).
tableauFigure 3 – Number of monthly visitors to London's three main museums(in number of visits)
| Date | July | August | September |
|---|---|---|---|
| 2004 | 1310732 | 1378145 | 900831 |
| 2005 | 1006441 | 935062 | 791586 |
| 2006 | 1263679 | 1295892 | 908113 |
| 2007 | 1210575 | 1334051 | 971076 |
| 2008 | 1376776 | 1569096 | 974255 |
| 2009 | 1391008 | 1535053 | 1035316 |
| 2010 | 1582672 | 1757164 | 1096573 |
| 2011 | 1672951 | 1716317 | 1142681 |
| 2012 | 1347432 | 1369344 | 1180540 |
| 2013 | 1862819 | 1895196 | 1332527 |
| 2014 | 1807908 | 1987960 | 1245301 |
| 2015 | 1869972 | 1789146 | 1228152 |
| 2016 | 1647950 | 1674270 | 1224481 |
- Note: visitor data for London’s three main museums (British museum, National Gallery and Natural History Museum).
- Source: DCMS-Sponsored Museums and Galleries Monthly Visits.
graphiqueFigure 3 – Number of monthly visitors to London's three main museums(in number of visits)
- Note: visitor data for London’s three main museums (British museum, National Gallery and Natural History Museum).
- Source: DCMS-Sponsored Museums and Galleries Monthly Visits.
tableauFigure 4a – Tourist spending per overnight stay in London(in pounds)
| date | Foreign visitors | British tourists | Total |
|---|---|---|---|
| 01/01/2009 | 95.68 | 93.61 | 95.32 |
| 01/01/2010 | 96.34 | 98.76 | 97.73 |
| 01/01/2011 | 102.73 | 88.56 | 99.49 |
| 01/01/2012 | 107.10 | 101.08 | 105.73 |
| 01/01/2013 | 117.22 | 102.18 | 113.85 |
| 01/01/2014 | 109.25 | 118.85 | 111.02 |
- Note: On the left-hand side, the data is expressed in financial years, i.e. starting on 6 April of the current year and ending on 5 April of the following year.
- Source: London Tourism Report 2014-2015, IPS (ONS).
graphiqueFigure 4a – Tourist spending per overnight stay in London(in pounds)
- Note: On the left-hand side, the data is expressed in financial years, i.e. starting on 6 April of the current year and ending on 5 April of the following year.
- Source: London Tourism Report 2014-2015, IPS (ONS).
tableauFigure 4b – Number of tourists and spending by foreign visitors throughout the UK(year-on-year)
| date | Foreign visitors | British tourists | Foreign visitor expenditure |
|---|---|---|---|
| 01/01/2011 | 4.5 | 3.8 | 6.4 |
| 01/04/2011 | 6.3 | 6.4 | 2.5 |
| 01/07/2011 | 1.8 | -2.0 | 13.5 |
| 01/10/2011 | 0.3 | 5.6 | 4.1 |
| 01/01/2012 | 1.9 | -1.7 | 2.3 |
| 01/04/2012 | 1.7 | -1.5 | 3.6 |
| 01/07/2012 | -3.9 | -1.0 | 10.3 |
| 01/10/2012 | 5.2 | 0.4 | -2.1 |
| 01/01/2013 | 1.6 | -0.9 | 9.0 |
- Source: London Tourism Report 2014-2015, IPS (ONS).
graphiqueFigure 4b – Number of tourists and spending by foreign visitors throughout the UK(year-on-year)
- Source: London Tourism Report 2014-2015, IPS (ONS).
In contrast, spending per visitor was much higher in 2012, especially in London (Figure 4.a). According to Delaplace, 2020, tourists coming to the London Olympic and Paralympic Games spent around three times more per day than ordinary tourists. All in all, in Q3 2012, total tourism revenues rose by around 10% compared with the previous year (Figure 4.b). In addition to ticket sales, this increase in tourism revenue mainly benefited the accommodation, food services and transport services sectors (Figure 5). It was inconsistent across the country, but also within the City of London: according to A. Blake, 2012, the increase in tourism was mainly concentrated in central and west London, where the Olympic venues were located.
tableauFigure 5 – Production index in services for various sectors in the United Kingdom(in base 100 = 2009)
| date | Distribution, Hotels and Restaurants | Transport, Storage and Communication | Business Services and Finance | Government and Other Services |
|---|---|---|---|---|
| Q1 2012 | 101.86 | 104.26 | 103.5 | 102.76 |
| Q2 2012 | 102.03 | 102.66 | 103.5 | 102.73 |
| Q3 2012 | 103.8 | 102.66 | 104.43 | 104.36 |
| Q4 2012 | 103.23 | 103.63 | 103.5 | 103.43 |
| Q1 2013 | 104.0 | 105.2 | 104.95 | 103.75 |
- Source: ONS.
graphiqueFigure 5 – Production index in services for various sectors in the United Kingdom(in base 100 = 2009)
- Source: ONS.
All in all, these indirect effects are less immediately measurable than those linked to ticket sales: the Bank of England estimated that they represented a gain in growth of around 0.2 GDP points in Q3 2012 (Bank of England, Inflation Report, 2012).
Consequently, the effect of the London Olympic and Paralympic Games on UK growth is estimated to have been between 0.2 and 0.4 points in Q3 2012: while the effect of ticket sales is accounted for, the knock-on effects on other tourism sectors are more uncertain. Quite logically, UK GDP edged down in Q4 2012 (-0.2%).
The impact of the Paris Olympic and Paralympic Games on economic activity in the summer is expected to be around +0.3 GDP points, as in London in 2012
The main results of London's experience in 2012 can be used to produce an ex ante estimation of the impact of the organisation of the Paris Olympic and Paralympic Games on French growth, both upstream and when the events are actually held. The estimate below draws on available data, especially the ex ante impact studies carried out by the French Centre for Sports Law and Economics (CDES) (CDES, 2016, 2024, see Appendix). It provides an initial assessment of how the national accounts could reflect the effects of the event, particularly in Q3 2024. However, this is only a forecast: ex post evaluations, in which INSEE is participating, of all the economic, social and environmental effects of the Olympic Games will be published.
Some of these positive effects have already been seen, notably in the construction sector
For the construction sector, Biausque et Le Fillâtre, 2023 have estimated the volume of hours worked and the employment sectors involved in the delivery of Olympic facilities: 45.4 million working hours were generated for the delivery of these facilities, either directly (via construction companies) or indirectly (via the construction sector's intermediate consumption of industrial products, legal, accounting and architectural services, etc.). These hours worked were concentrated primarily during the 2020-2023 period: the construction of Olympic facilities is estimated to have increased activity by around €2 billion over this period. In full-time equivalent terms, it is estimated that the delivery of Olympic facilities involved 4,300 jobs in 2023 compared with 1,600 in 2024: the contribution to growth has therefore been somewhat negative in 2024, although the construction of temporary infrastructure could limit this decline.
Ticket sales and broadcasting revenues have a direct positive effect on activity
As for the London Olympic and Paralympic Games, the main impact on activity to be expected in Q3 2024 – when the events are actually held – corresponds to ticketing receipts: adopting a similar approach to that used by the ONS in 2012, ticketing receipts are recorded in the national accounts as sports recreation services at the moment the events are held, even though the ticketing system for the Paris Olympic Games was set up in 2023. This is because the activity of sports recreation services is measured at the moment of their consumption by the public: this consumption should therefore increase significantly in Q3 2024 (ticket sales for the Paris Olympic and Paralympic Games are expected to contribute almost €1.2 billion to the resources of the Organising Committee for the Olympic and Paralympic Games – OCOPG). The net effect is likely to be slightly lower due to crowding-out effects (other cultural activities such as the museums and shows normally consumed by tourists are expected to decline, as in London in 2012), but these effects are secondary to the accounting effect of the recording of ticket sales. In this way, the Olympic and Paralympic Games, at which around two thirds of spectators are expected to be French residents, should account for an 8% increase in quarterly consumption of “other household services” (i.e. +0.15 GDP points in Q3 2024), with an equivalent backlash occurring in Q4 2024.
As with ticket sales, the recording of the OCOPG's audiovisual broadcasting revenues (approximately €750 million) in Q3 2024 should have a direct impact on activity measured. In fact, the sale of broadcasting rights corresponds to the production of services offset, on the use side, by exports from France to broadcasters in the rest of the world (with sales to French broadcasters being marginal). Exports of services are therefore set to rise in Q3 (contributing around +0.1 points of GDP), with an equivalent contraction at the end of the year.
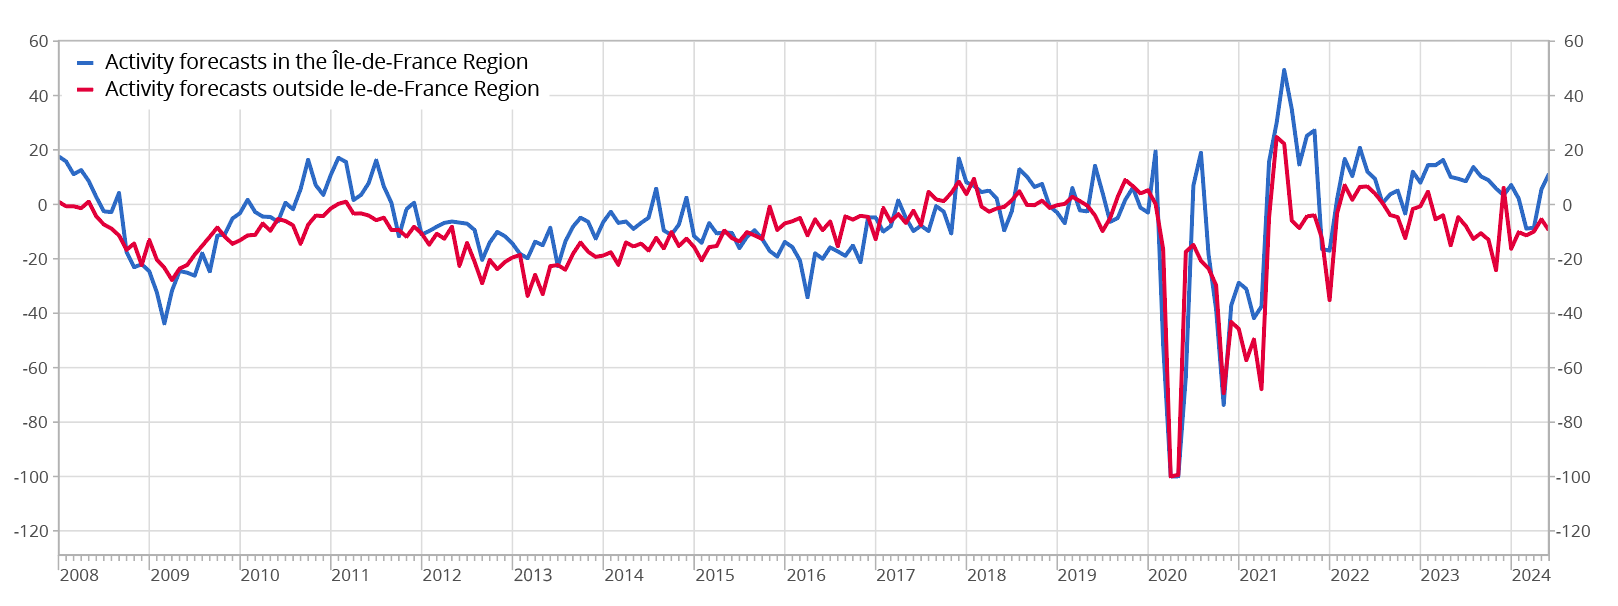
In the spring, accommodation and food-service companies in the Île-de-France region were optimistic about their three-month business expectations, pointing towards an “OPG” effect in the sector
Estimating the impact of the Paris Olympic and Paralympic Games on the accommodation and food services sector is more complicated and depends on the assumption made concerning the extent of the crowding-out effect on tourist flows: while the London precedent argues for a relatively strong effect, the CDES, in its impact assessment, assumes a more limited effect, of approximately 22%. Meanwhile, INSEE's Business Tendency Surveys in the accommodation and food services sector convey a fairly favourable message (Figure 6). In May and June, activity forecasts for the next three months (the period covering the OPG) were much higher than in previous months, with hotel and restaurant owners in the Paris Region (20% of the sector's national activity) being more optimistic than the others, adjusting for the usual seasonality. The difference between the responses of businesses in the Île-de-France region and others was consistent with major events in the past: from December 2015 to the end of 2016, businesses in the accommodation and food services sector in the Île-de-France region were much more pessimistic, reflecting the decline in the attractiveness of Paris as a destination following the terrorist attacks. In H1 2023, the increased optimism in the Île-de-France region reflected the reopening of international air routes, particularly with Asia.
All in all, the improvement in the business climate in the accommodation and food services sector in the spring, assuming that it was attributable to the Olympic Games, is likely to result in an increase in activity in the sector in the summer, as the business climate correlates closely with the year-on-year change in consumption in the sector (Figure 7). The consumption of accommodation and food services could therefore be boosted by +0.6 points in Q3 2024, with an equivalent impact in Q4 2024.
In addition to INSEE's Business Tendency Surveys, France Travail's “Besoin de Main-d'Oeuvre” (Labour Needs) survey points towards a 4% increase in recruitment intentions in the accommodation and food services sector in the Île-de-France region (including an 8.7% increase in Paris) in 2024, compared with a 1.3% increase for the sector as a whole. Accommodation offered by private individuals via platforms (Airbnb, for example), which is particularly buoyant in the context of the Paris Olympic and Paralympic Games, is given special treatment in the national accounts (Askenazy et Bourgeois, 2024); as a result, this type of accommodation should not to have a significant accounting impact on activity.
graphiqueFigure 6 – Opinion on expected activity in the accommodation and food services sector in Île-de-France versus outside the l’Île-de-France(balance of opinion, seasonally adjusted)
- Last point: June 2024.
- Source: monthly business survey in services, INSEE.
graphiqueFigure 7 – Business climate and consumption in the French accommodation and food services sector(left-hand side: year-on-year in % ; right-hand side: quarterly centered-reduced average at 100)
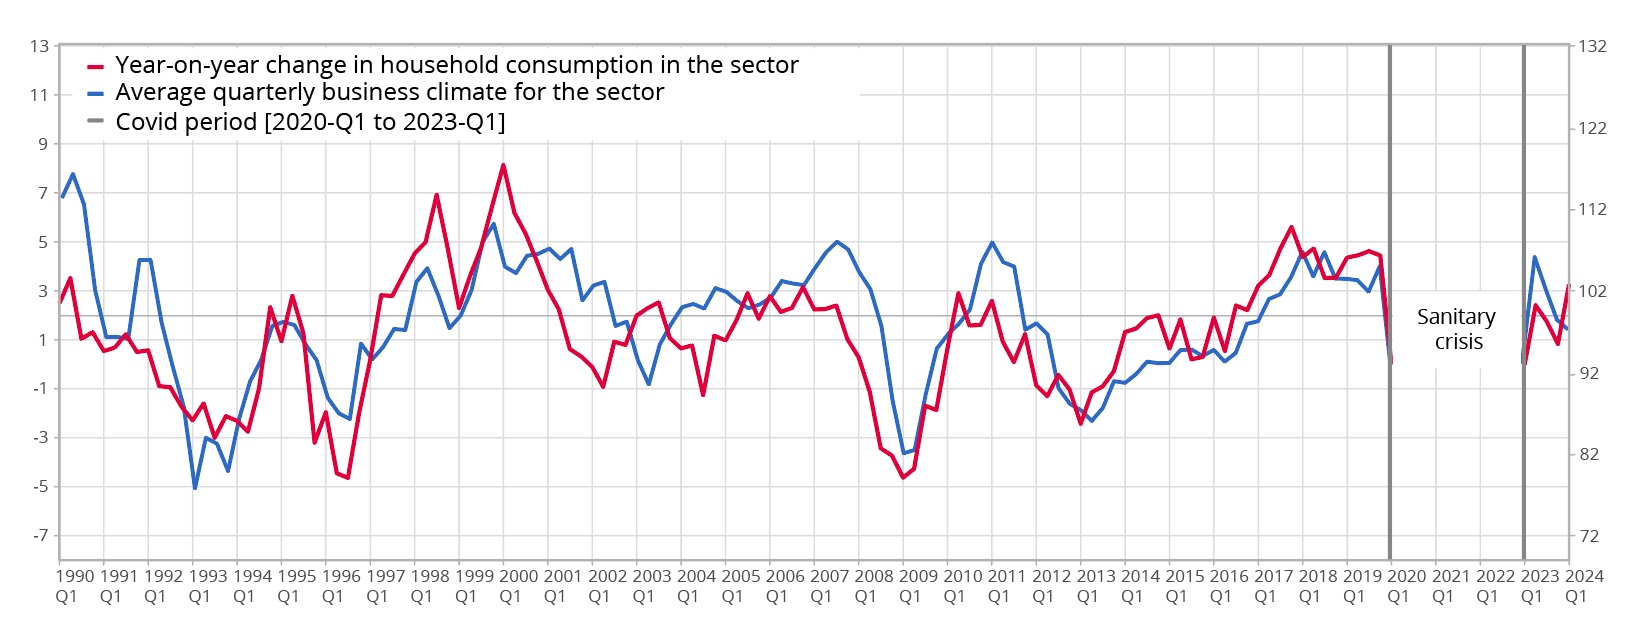
- Last point: Q1 2024
- Source: monthly business survey in services, quarterly national accounts, INSEE.
Transport consumption is set to rise sharply compared with a normal summer
The Paris OPG could generate a significant increase in public transport activity compared with the usual tourist flows, given the geographical dispersion of the events in the Île-de-France region and the significance of Île-de-France public transport within national transport services. According to Île-de-France Mobilités, public transport services in the Île-de-France region should see a one-off increase of 15% over the period of the Games. In addition to public transport, long-distance rail traffic is also set to increase this summer: firstly, some of the events are taking place outside the Paris region and, secondly, the probable increase in teleworking should generate additional mobility. With this in mind, the French state rail network (SNCF) has increased its capacity by around 400,000 seats on long-distance routes for the summer of 2024. The total impact on transport consumption attributable to the Olympic Games should therefore amount to around +1.4 points in Q3 2024.
Bonuses paid to civil servants reflect an increase in the production of non-market services
The Paris Olympic and Paralympic Games are also expected to increase the value added by the non-market services provided by general government (mobilisation of the gendarmes and police, health services, etc.): the exceptional bonuses paid out to the civil servants involved should have a directly quantifiable impact on activity in the branch, reflecting the additional service provided by the public authorities during this period. However, this impact, of around €0.4 bn, could be spread over several quarters.
Other effects, of limited scope, could appear
Lastly, certain indirect effects on household consumption of household equipment could be considered: INSEE, 2010 suggests that Football World Cup tournaments have a positive effect on the consumption of television sets. However, this effect is not systematic and is combined with a substitution effect on other products. In this Economic Outlook, no such effect has been identified.
Finally, the demand shock generated by the OCOPG via its orders to suppliers – mainly services (security, marketing, insurance, etc.) – is likely to have already occurred, at least in part. Its impact in H2 2024 will probably be difficult to quantify and in any case limited. In national accounting terms, the OCOPG's expenditure corresponds mainly to intermediate consumptions, which certainly increase the value added by the suppliers but reduce that of the OCOPG by the same amount: the net effect on GDP ultimately corresponds to the production of recreational services by the OCOPG (sales of tickets and TV rights).
All in all, hosting the Olympic and Paralympic Games is expected to boost French growth in Q3 2024 (Figure 8.a and Figure 8.b): the impact of ticket sales and rebroadcasting rights should amount to around +0.25 GDP points, to which knock-on effects should be added, especially in tourism (accommodation, catering and transport), in addition to bonuses for civil servants, which will be present throughout the Games: these effects are more uncertain but could add a further +0.05 points to quarterly growth this summer. As a backlash, activity is expected to come to a standstill at the end of the year. On the demand side, the counterpart to this increase in activity is divided equally between household consumption and exports of services (including tourism). These direct, short-term effects on growth are not directly comparable with the economic impact of the event as measured by the CDES (see box).
tableauFigure 8a - Forecasts for GDP, household consumption and exports in France
| 2023 | 2024 | 2023 | 2024 | |||||||
|---|---|---|---|---|---|---|---|---|---|---|
| Q1 | Q2 | Q3 | Q4 | Q1 | Q2 | Q3 | Q4 | |||
| Gross domestic product | 0.1 | 0.7 | 0.1 | 0.3 | 0.2 | 0.3 (p) | 0.5 (p) | -0.1 (p) | 1.1 | 1.1 (p) |
| Household consumption expenditure | 0.2 | 0.0 | 0.5 | 0.2 | 0.1 | 0.5 (p) | 0.7 (p) | 0.1 (p) | 0.9 | 1.3 (p) |
| Exportations | -1.4 | 3.0 | -1.1 | 1.0 | 1.2 | 1.4 (p) | 0.8 (p) | -0.5 (p) | 2.5 | 3.5 (p) |
- (p): Prévisions
- Source: Insee.
tableauFigure 8b - Forecasts for GDP, household consumption and exports in France in the absence of the Olympic Games
| 2023 | 2024 | 2023 | 2024 | |||||||
|---|---|---|---|---|---|---|---|---|---|---|
| T1 | T2 | T3 | T4 | T1 | T2 | T3 | T4 | |||
| Gross domestic product | 0.1 | 0.7 | 0.1 | 0.3 | 0.2 | 0.3 (p) | 0.2 (p) | 0.2 (p) | 1.1 | 1.0 (p) |
| Household consumption expenditure | 0.2 | 0.0 | 0.5 | 0.2 | 0.1 | 0.5 (p) | 0.4 (p) | 0.4 (p) | 0.9 | 1.2 (p) |
| Exportations | -1.4 | 3.0 | -1.1 | 1.0 | 1.2 | 1.4 (p) | 0.3 (p) | 0.1 (p) | 2.5 | 3.4 (p) |
- (p): Prévisions
- Source: Insee.
Economic impact assessment of the Paris 2024 Olympic Games
Ex ante impact assessments have considered the macroeconomic benefits of the Paris Olympic Games in terms of business activity. Following an initial evaluation in 2016, the French Centre for Sports Law and Economics (CDES, 2024) proposed three scenarios in May 2024, describing the timing of the shock as well as some major channels through which the shock could be propagated: tourism, construction and the organisational expenditure of the Organising Committee for the Olympic and Paralympic Games (OCOPG). According to this study, the Olympic Games are likely to have an economic impact of between €6.7 bn and €11.1 bn, with a central value of €9.0 bn. However, these figures are not directly comparable with the impacts on short-term growth estimated in this Focus, for a number of reasons:
- These figures cover the 2018-2034 period and pay particular attention to residual effects once the event is over, which are not examined in this report;
- They only concern the Île-de-France region and not the whole of France; however, some of the economic benefits for the Île-de-France Region may originate from national players based outside the region: such inter-regional flows have no impact on the French economy as a whole. This applies, for example, to the expected economic effects in terms of tourism: the CDES assumes a spectator breakdown of around one third Parisians, one third non-Parisians and one third foreign visitors, and counts the spending of the latter two categories as tourism revenue. However, spending by French residents outside the Paris region during the Games is likely to be only slightly additional, and could, on the contrary, replace spending by residents that would have occurred in France anyway. However, this substitution effect might be at least partly offset by an additionality effect for foreign tourists: the saturation of tourism in the Île-de-France region could trigger shifts of visitors to other tourist sites in France not affected by the Games.
- The CDES figures include multiplier effects to take account of the macroeconomic impact of the additional activity generated by the organisation of the Games, whereas only the direct short-term effect is considered in this report.
- The CDES figures include all of the OCOPG's expenditure in the “organisation” category. However, in the national accounts, some of this expenditure corresponds to transfers between agents, with no direct impact on GDP. It also includes orders to suppliers, mainly for services (security, marketing, insurance, etc.), whose impact on GDP is already likely to have occurred and which in any case would be complex to identify in the national accounts series.
The impact on GDP in London alone was estimated at £5.9 bn – greater than the impact on national GDP – due to inter-regional transfers benefiting the capital region to the detriment of the rest of the country.
The impact on GDP in London alone was estimated at £5.9 bn – greater than the impact on national GDP – due to inter-regional transfers benefiting the capital region to the detriment of the rest of the country.