

Quarterly national accounts in Q1 2018 National accounts in base 2014 - Detailed figures
French GDP slowed down in Q1 2018 (+0.3% after +0.7%) Quarterly national accounts - first estimate - first quarter 2018
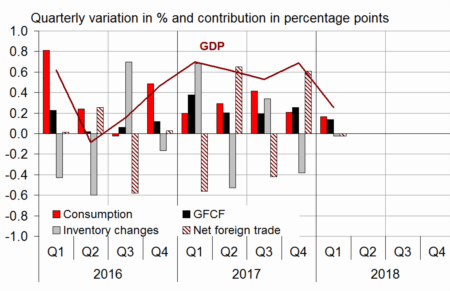
In Q1 2018, GDP in volume terms* accelerated: +0.3% after +0.7% in Q4 2017. Household consumption expenditures rose at the same pace as in Q4 2017 (+0.2%), whereas total gross fixed capital formation lost momentum (GFCF: +0.6% after +1.1%). Overall, final domestic demand excluding inventory changes slowed down and contributed less to GDP growth: +0.3 points after +0.5 points.
Exports weakened slightly (−0.1% after +2.5%) and imports held steady (0.0% after +0.4%). All in all, foreign trade balance didn't contribute to GDP growth in Q1. Similarly, changes in inventories were stable and therefore they didn't contribute to GDP growth.

* This growth rate is seasonally and working-day adjusted; volumes are chain-linked previous-year-prices volumes.
graphiqueGraph – GDP and its main components
- Source: INSEE
tableauTab1 – GDP and its main components: chain-linked volumes
| 2017 Q2 | 2017 Q3 | 2017 Q4 | 2018 Q1 | 2017 | 2018 (ovhg) | |
|---|---|---|---|---|---|---|
| GDP | 0.6 | 0.5 | 0.7 | 0.3 | 2.0 | 1.2 |
| Imports | -0.3 | 2.0 | 0.4 | 0.0 | 4.1 | 1.2 |
| Household consumption *expenditure | 0.3 | 0.5 | 0.2 | 0.2 | 1.3 | 0.7 |
| General government's *consumption expenditure | 0.5 | 0.5 | 0.4 | 0.3 | 1.6 | 1.0 |
| GFCF | 0.9 | 0.9 | 1.1 | 0.6 | 3.8 | 2.1 |
| *of which Non-financial corporated and unincorporated enterprises | 0.9 | 1.2 | 1.6 | 0.5 | 4.4 | 2.5 |
| Households | 1.4 | 0.9 | 0.6 | 0.5 | 5.4 | 1.7 |
| General government | 0.1 | -0.2 | 0.5 | 0.9 | -1.0 | 1.2 |
| Exports | 2.0 | 0.7 | 2.5 | -0.1 | 3.3 | 2.6 |
| Contributions: | ||||||
| Internal demand excluding inventory changes | 0.5 | 0.6 | 0.5 | 0.3 | 1.9 | 1.1 |
| Inventory changes | -0.5 | 0.3 | -0.4 | 0.0 | 0.5 | -0.3 |
| Net foreign trade | 0.7 | -0.4 | 0.6 | 0.0 | -0.3 | 0.4 |
- Source: INSEE
Total production decelerated
Production in goods and services slowed down in Q1 2018 (+0.3% after +0.9%). It fell back markedly in goods (−0.6% after +1.2%) while it continued to grow at a sustained pace in services (+0.5% after +0.8%).
Output in manufactured goods fell back (−1.1% after +1.5%), mainly owing to a significant decrease in transport equipment. However, production in electricity and gas picked up (+2.1% after +0.0%) as well as in construction (+0.6% after +0.0%).
tableauTab2 – Production, consumption and GFCF: main components
| 2017 Q2 | 2017 Q3 | 2017 Q4 | 2018 Q1 | 2017 | 2018 (ovhg) | |
|---|---|---|---|---|---|---|
| Production of branches | 0.8 | 0.7 | 0.9 | 0.3 | 2.4 | 1.5 |
| Goods | 0.7 | 0.9 | 1.2 | -0.6 | 2.0 | 0.9 |
| Manufactured Industry | 0.7 | 0.7 | 1.5 | -1.1 | 2.0 | 0.5 |
| Construction | 1.1 | 0.5 | 0.0 | 0.6 | 2.6 | 1.2 |
| Market services | 0.8 | 0.8 | 1.0 | 0.6 | 2.9 | 1.9 |
| Non-market services | 0.5 | 0.5 | 0.4 | 0.3 | 1.4 | 1.0 |
| Household consumption | 0.3 | 0.5 | 0.2 | 0.2 | 1.3 | 0.7 |
| Food products | 0.6 | -0.5 | 0.3 | -0.5 | 0.8 | -0.3 |
| Energy | 0.5 | 1.5 | -0.6 | 1.4 | 0.0 | 1.8 |
| Engineered goods | 0.2 | 1.2 | -0.1 | -0.2 | 1.7 | 0.3 |
| Services | 0.3 | 0.6 | 0.5 | 0.4 | 1.8 | 1.1 |
| GFCF | 0.9 | 0.9 | 1.1 | 0.6 | 3.8 | 2.1 |
| Manufactured goods | 0.1 | 1.4 | 1.7 | -0.9 | 1.8 | 1.1 |
| Construction | 1.1 | 0.5 | 0.5 | 0.6 | 2.6 | 1.4 |
| Market services | 1.1 | 1.1 | 1.6 | 1.6 | 6.5 | 3.7 |
- Source: INSEE
Household consumption remained sluggish
Household consumption expenditure continued to be sluggish in Q1 2018 (+0.2% after +0.2%): consumption of goods was stable for the second consecutive quarter while that of services slowed down slightly (+0.4% after +0.5%).
Particularly, consumption of food products declined (−0.5% after +0.3%) while expenditure on energy bounced back (+1.4% after −0.6%) because of temperatures lower than the seasonal norms in February and March.
tableauTab3 – Sectoral accounts
| 2017 Q2 | 2017 Q3 | 2017 Q4 | 2018 Q1 | 2016 | 2017 | |
|---|---|---|---|---|---|---|
| Profit ratio of NFCs* (level) | 31.8 | 31.8 | 31.9 | 31.8 | 31.7 | |
| Households' purchasing power | 0.6 | 0.5 | 0.2 | 1.8 | 1.5 |
- *NFCs: non-financial corporations
- Source: INSEE
tableauTab4 – Households' disposable income and ratios of households' account
| 2017 Q2 | 2017 Q3 | 2017 Q4 | 2018 Q1 | 2016 | 2017 | |
|---|---|---|---|---|---|---|
| HDI | 0.5 | 0.6 | 0.6 | 1.7 | 2.4 | |
| Household purchasing power | 0.6 | 0.5 | 0.2 | 1.8 | 1.5 | |
| HDI by cu* (purchasing power) | 0.5 | 0.4 | 0.1 | 1.4 | 1.1 | |
| Adjusted HDI (purchasing power) | 0.6 | 0.5 | 0.2 | 1.7 | 1.6 | |
| Saving rate (level) | 14.2 | 14.2 | 14.2 | 14.0 | 14.2 | |
| Financial saving rate (level) | 4.4 | 4.4 | 4.5 | 4.7 | 4.4 |
- *cu: consumption unit
- Source: INSEE
Corporate investment decelerated, household investment was almost stable
In Q1 2018, total GFCF increased at a lower pace (+0.6% after +1.1 in Q4 2017), especially because of the slowdown in corporate investment (+0.5% after +1.6%). It was mainly due to the decline in manufactured goods (−0.9% after +1.7%). Household investment grew at almost the same pace as the previous quarter (+0.5% after +0.6%) because of the good performance of the construction sector.
tableauTab5 – Ratios of non-financial corporations' account
| 2017 Q2 | 2017 Q3 | 2017 Q4 | 2018 Q1 | 2016 | 2017 | |
|---|---|---|---|---|---|---|
| Profit share | 31.8 | 31.8 | 31.9 | 31.8 | 31.7 | |
| Investment ratio | 23.7 | 23.8 | 24.0 | 23.3 | 23.8 | |
| Savings ratio | 19.8 | 19.9 | 19.2 | 19.7 | 19.7 | |
| Self-financing ratio | 83.3 | 83.7 | 79.9 | 84.3 | 82.5 |
- Source: INSEE
Foreign trade balance contribution on GDP growth was null
Exports were almost stable in Q1 2018 after the marked dynamism observed in Q4 2017 (−0.1% after +2.5%), especially in transport equipment. At the same time, imports were stable (+0.0% after +0.4%). All in all, foreign trade balance did not contribute to GDP growth, after a contribution of +0.6 points in the previous quarter.
tableauTab6 – Expenditure. receipts and net borrowing of public administrations)
| 2017 Q2 | 2017 Q3 | 2017 Q4 | 2018 Q1 | 2016 | 2017 | |
|---|---|---|---|---|---|---|
| In billions of euros | ||||||
| Total expenditure | 321.4 | 324.5 | 326.9 | 1260.7 | 1292.3 | |
| Total receipts | 306.7 | 308.6 | 315.1 | 1184.8 | 1232.8 | |
| Net lending (+) or borrowing (–) | -14.7 | -15.9 | -11.8 | –75.8 | -59.6 | |
| In % of GDP | ||||||
| Net lending (+) or borrowing (–) | -2.6 | -2.8 | -2.0 | –3.4 | -2.6 |
- Source: INSEE
Revisions
GDP growth estimate for Q4 2017 is confirmed. Slight revisions in different aggregates offset each other; they are mainly due to the revision of indicators and to the update of seasonal adjustment coefficients.
Avertissement
Quarterly national accounts
Quarterly debt of the general government
Sources
Quarterly national accounts
Quarterly accounts are a consistent set of indicators which provides a global overview of recent economic activity.
Time series of the main aggregates of quarterly national accounts can be accessed through the "Summary". They are classified into eight categories:
- Gross domestic product (GDP) and main economic aggregates ;
- Goods and services ;
- Households' consumption ;
- Foreign trade ;
- Activities ;
- Institutional sectors ;
- Households' income and purchasing power ;
- Public finances.
For each category, are available :
- synthetic files displaying from the accounts the relevant information for economic analysis ,
- sometimes, one or two files displaying all the data available.
Documentation
Abbreviated methodology (pdf, 140 Ko )
Methodology - First estimate at 30 days (pdf, 112 Ko )