


Quarterly national accounts in Q1 2017 National accounts in base 2010 - Detailed figures
In Q1 2017, households' purchasing power and non-financial corporations' profit ratio were almost stable Quarterly national accounts - detailed figures - first quarter 2017
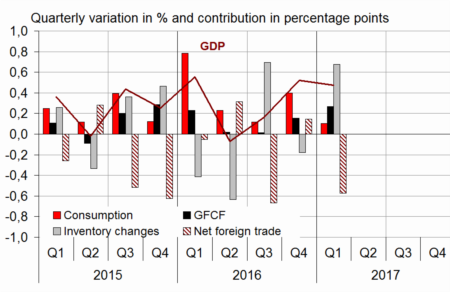
In Q1 2017, GDP in volume terms* kept increasing: +0.5%, as in Q4 2016.
Households' consumption expenditure was at a standstill in Q1 (0.0% after +0.6%) while total gross fixed capital formation accelerated sharply (GFCF; +1.2% after +0.7%). All in all, final domestic demand excluding inventory changes decelerated slightly: it contributed for +0.4 points to GDP growth after +0.6 points in the previous quarter.
Exports fell back (−0.7% after +1.1%) while imports accelerated (+1.2% after +0.6%). All in all, foreign trade balance weighed down on GDP growth: −0.6 points after +0.1 points. Conversely, changes in inventories contributed positively (+0.7 points after −0.2 points).

* This growth rate is seasonally and working-day adjusted; volumes are chain-linked previous-year-prices volumes.
graphiqueGraph – GDP and its main components
- Source: INSEE
tableauTab1 – GDP and its main components: chain-linked volumes
| 2016 Q2 | 2016 Q3 | 2016 Q4 | 2017 Q1 | 2016 | 2017 (ovhg) | |
|---|---|---|---|---|---|---|
| GDP | -0.1 | 0.2 | 0.5 | 0.5 | 1.1 | 0.9 |
| Imports | -0.7 | 2.8 | 0.6 | 1.2 | 4.2 | 2.8 |
| Household consumption *expenditure | 0.3 | 0.0 | 0.6 | 0.0 | 2.1 | 0.6 |
| General government's *consumption expenditure | 0.3 | 0.4 | 0.3 | 0.3 | 1.2 | 0.8 |
| GFCF | 0.1 | 0.1 | 0.7 | 1.2 | 2.7 | 1.8 |
| *of which Non-financial corporated and unincorporated enterprises | -0.3 | -0.1 | 0.9 | 1.9 | 3.4 | 2.5 |
| Households | 0.7 | 0.9 | 1.0 | 1.0 | 2.4 | 2.3 |
| General government | 0.4 | -0.8 | -0.5 | -0.7 | -0.1 | -1.4 |
| Exports | 0.3 | 0.7 | 1.1 | -0.7 | 1.9 | 0.5 |
| Contributions : | ||||||
| Internal demand excluding inventory changes | 0.2 | 0.1 | 0.6 | 0.4 | 2.0 | 0.9 |
| Inventory changes | -0.6 | 0.7 | -0.2 | 0.7 | -0.1 | 0.8 |
| Net foreign trade | 0.3 | -0.7 | 0.1 | -0.6 | -0.8 | -0.7 |
- Source: INSEE
tableauTab2 – Production, consumption and GFCF: main components
| 2016 Q2 | 2016 Q3 | 2016 Q4 | 2017 Q1 | 2016 | 2017 (ovhg) | |
|---|---|---|---|---|---|---|
| Production of branches | -0.3 | 0.3 | 0.7 | 0.5 | 0.9 | 1.1 |
| Goods | -0.6 | 0.2 | 1.0 | -0.1 | 0.2 | 0.7 |
| Manufactured Industry | -0.8 | 0.7 | 0.7 | -0.1 | 0.8 | 0.6 |
| Construction | 0.0 | 0.1 | 0.9 | 0.5 | 0.1 | 1.2 |
| Market services | -0.3 | 0.3 | 0.7 | 0.9 | 1.4 | 1.5 |
| Non-market services | 0.2 | 0.3 | 0.3 | 0.3 | 1.0 | 0.6 |
| Household consumption | 0.3 | 0.0 | 0.6 | 0.0 | 2.1 | 0.6 |
| Food products | -0.3 | 0.6 | -0.2 | 0.4 | 0.9 | 0.5 |
| Energy | 1.2 | -1.2 | 3.4 | -3.3 | 2.2 | -1.2 |
| Engineered goods | 0.4 | -1.2 | 1.0 | 0.1 | 2.4 | 0.4 |
| Services | 0.0 | 0.5 | 0.3 | 0.5 | 1.6 | 1.0 |
| GFCF | 0.1 | 0.1 | 0.7 | 1.2 | 2.7 | 1.8 |
| Manufactured goods | -1.1 | -2.0 | 0.4 | 1.6 | 6.1 | 0.7 |
| Construction | 0.4 | -0.1 | 0.8 | 0.5 | 0.2 | 1.2 |
| Market services | 0.5 | 1.7 | 0.8 | 1.8 | 3.9 | 3.4 |
- Source: INSEE
Purchasing power was virtually steady in Q1 2017
Households' gross disposable income (GDI) accelerated in Q1 2017 (+0.6% after +0.4%).Indeed, wages received by households increased faster than at the end of 2016 (+0.9% after +0.6%): employment remained dynamic and the average wage per capita accelerated in the private sector while the civil service salary index point was reevalued by 0.6% on 1st February 2017. Furthermore, taxes on incomes and wealth slowed down in early 2017 (+0.5% after +1.0%), as abacklash after the significant adjustments made at the end of 2016, and because of the decrease in income tax instalments from the 20% tax reduction for low-income households and of the exceptional increase on 1st January 2017 of the thresholds of exemption or reduced rate of supplementary general sociale contribution (contribution sociale généralisée, CSG) on replacement incomes.
On their side, social benefits in cash followed an upward trend (+0.4% after +0.3%), as well as social contributions paid by households (+0.6% after +0.7%).
Besides, households' consumption prices accelerated in Q1 2017 (+0.5% after +0.3%), so that households' purchasing power was virtually stable (+0.1% as in Q4 2016). Measured per consumption unit, it held steady for the second consecutive quarter.
In Q1 2017, as households' consumption in volume terms was stable and households' purchasing power remained virtually unchanged, their saving ratio was virtually stable at 14.0% of their income after 13.9% in Q4 2016.
tableauTab3 – Sectoral accounts
| 2016 Q2 | 2016 Q3 | 2016 Q4 | 2017 Q1 | 2016 | 2017 (ovhg) | |
|---|---|---|---|---|---|---|
| Profit ratio of NFCs* (level) | 31.7 | 31.6 | 31.8 | 31.7 | 31.8 | |
| Households' purchasing power | 0.3 | 0.7 | 0.1 | 0.1 | 1.8 | 0.6 |
- *NFCs: non-financial corporations
- Source: INSEE
tableauTab4 – Households' disposable income and ratios of households' account
| 2016 Q2 | 2016 Q3 | 2016 Q4 | 2017 Q1 | 2016 | 2017 (ovhg) | |
|---|---|---|---|---|---|---|
| HDI | 0.3 | 0.8 | 0.4 | 0.6 | 1.7 | 1.4 |
| Household purchasing power | 0.3 | 0.7 | 0.1 | 0.1 | 1.8 | 0.6 |
| HDI by cu* (purchasing power) | 0.2 | 0.6 | 0.0 | 0.0 | 1.4 | 0.4 |
| Adjusted HDI (purchasing power) | 0.3 | 0.6 | 0.1 | 0.2 | 1.7 | 0.7 |
| Saving rate (level) | 13.8 | 14.4 | 13.9 | 14.0 | 14.0 | |
| Financial saving rate (level) | 4.5 | 5.1 | 4.6 | 4.5 | 4.7 |
- *cu: consumption unit
- Source: INSEE
Non-financial corporations' profit ratio was practically stable at 31.7% in Q1 2017
In Q1 2017, non-financial corporations' profit ratio was almost stable at 31.7% (after 31.8%). Terms of trade weighed due to the increase in energy prices and despite an increase in selling prices. Conversely, non-financial corporations generated productivity gains, while real wages remained broadly stable.
tableauTab5 – Ratios of non-financial corporations' account
| 2016 Q2 | 2016 Q3 | 2016 Q4 | 2017 Q1 | 2016 | |
|---|---|---|---|---|---|
| Profit share | 31.7 | 31.6 | 31.8 | 31.7 | 31.8 |
| Investment ratio | 23.4 | 23.3 | 23.4 | 23.7 | 23.3 |
| Savings ratio | 19.4 | 19.5 | 19.8 | 20.0 | 19.7 |
| Self-financing ratio | 83.1 | 83.4 | 84.6 | 84.4 | 84.2 |
- Source: INSEE
In Q1 2017, general government deficit was virtually steady
In Q1 2017, general government net borrowing was virtually steady, at 3.3% of GDP after 3.2% in Q4 2016, as receipts and expenditure increased at around the same pace.
Spending bounced back (+0.7% after 0.0%), mainly as a backslash after the decrease in the French contribution to the European Union budget at the end of 2016. Moreover, general government wage bill accelerated slightly. Social benefits paid followed an upward trend.
At the same time, receipts slowed a little in Q1 (+0.5% after +0.8%). Corporation tax fell back, production taxes increased steadily again and social contributions receipts slowed down slightly.
tableauTab6 – Expenditure, receipts and net borrowing of public administrations
| 2016 Q2 | 2016 Q3 | 2016 Q4 | 2017 Q1 | 2016 | |
|---|---|---|---|---|---|
| In billions of euros | |||||
| Total expenditure | 313.5 | 315.2 | 315.1 | 317.3 | 1257.0 |
| Total receipts | 294.9 | 294.8 | 297.1 | 298.7 | 1181.2 |
| Net lending (+) or borrowing (-) | -18.5 | -20.4 | -18.0 | -18.7 | -75.8 |
| In % of GDP | |||||
| Net lending (+) or borrowing (-) | -3.3 | -3.7 | -3.2 | -3.3 | -3.4 |
- Source: INSEE
Revisions
With the integration of new informations now available, the estimate of GDP growth in Q1 2017 has been revised upward from +0.4% to +0.5%.
Avertissement
Quarterly national accounts
Quarterly debt of the general government
Sources
Quarterly national accounts
Quarterly accounts are a consistent set of indicators which provides a global overview of recent economic activity.
Time series of the main aggregates of quarterly national accounts can be accessed through the "Summary". They are classified into eight categories:
- Gross domestic product (GDP) and main economic aggregates ;
- Goods and services ;
- Households' consumption ;
- Foreign trade ;
- Activities ;
- Institutional sectors ;
- Households' income and purchasing power ;
- Public finances.
For each category, are available :
- synthetic files displaying from the accounts the relevant information for economic analysis ,
- sometimes, one or two files displaying all the data available.
Documentation
Abbreviated methodology (pdf, 140 Ko )
Methodology - First estimate at 30 days (pdf, 112 Ko )