


Quarterly national accounts in Q2 2016 National accounts in base 2010 - Detailed figures
In Q2 2016, households' purchasing power increased slightly and corporations' profit ratio decreased Quarterly national accounts - detailed figures - 2nd Quarter 2016
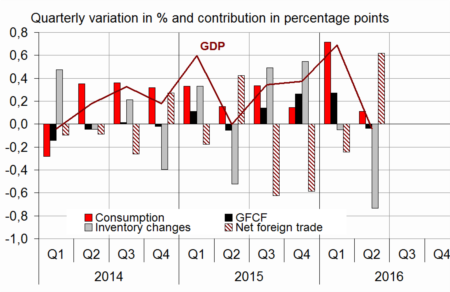
In Q2 2016, gross domestic product (GDP) in volume terms* declined slightly: -0.1% after +0.7% in the first quarter.
In Q2 2016, gross domestic product (GDP) in volume terms* declined slightly: −0.1% after +0.7% in the first quarter.
Household final consumption expenditure edged down in Q2 2016 (−0.1% after +1.1%), as well as total gross fixed capital formation (GFCF) (−0.2% after +1.3%). With public expenditures, final domestic demand (excluding inventory changes) made a zero contribution to GDP growth in Q2 2016 (after +0.9 points in Q1 2016). Imports decreased sharply (−1.8% after 0.2%) while exports increased slightly (+0.2% after −0.4%). Thus, foreign trade balance contributed positively to GDP growth (+0.6 points after −0.2 points).Conversely, changes in inventories contributed negatively to GDP growth: −0.7 points after −0.1 points in Q1.
graphiqueGraph1 – GDP and its main components
- Source: INSEE
tableauTab1 – Goods and services:supply and uses chain-linked volumes
| 2015 Q3 | 2015 Q4 | 2016 Q1 | 2016 Q2 | 2015 | 2016 (ovhg) | |
|---|---|---|---|---|---|---|
| GDP | 0.4 | 0.4 | 0.7 | -0.1 | 1.2 | 1.1 |
| Imports | 1.7 | 2.2 | 0.2 | -1.8 | 6.4 | 1.5 |
| Household consumption *expenditure | 0.5 | 0.0 | 1.1 | -0.1 | 1.5 | 1.3 |
| General government's *consumption expenditure | 0.3 | 0.4 | 0.4 | 0.4 | 1.4 | 1.3 |
| GFCF | 0.7 | 1.2 | 1.3 | -0.2 | 0.9 | 2.3 |
| *of which Non-financial corporated and unincorporated enterprises | 0.4 | 1.6 | 2.1 | -0.4 | 2.7 | 3.4 |
| Households | 0.0 | 0.2 | 0.1 | -0.3 | -0.8 | 0.1 |
| General government | 2.7 | 1.5 | 0.1 | 0.7 | -3.9 | 2.2 |
| Exports | -0.2 | 0.6 | -0.4 | 0.2 | 6.0 | 0.5 |
| Contributions : | ||||||
| Internal demand excluding inventory changes | 0.5 | 0.4 | 0.9 | 0.0 | 1.3 | 1.5 |
| Inventory changes | 0.5 | 0.5 | -0.1 | -0.7 | 0.2 | -0.1 |
| Net foreign trade | -0.6 | -0.5 | -0.2 | 0.6 | -0.3 | -0.3 |
- Source: Insee
Households' purchasing power slowed down
In nominal terms, households' gross disposable income (GDI) slowed down in Q2 (+0.3% after +0.5%), mainly due to the deceleration in wages received by households (+0.4% after +0.8%). Besides, social benefits in cash slowed down slightly (+0.3% after +0.4%). However, taxes on income and wealth were less dynamic (+0.4% after +0.7%), as well as social contributions paid (0.0% after +0.9%), which moderated slightly the GDI overall deceleration.
Household consumption prices accelerated slightly in Q2 (+0.1% after −0.1%), hence households' purchasing power kept on increasing, but slowed down more sharply than GDI (+0.2% after +0.6% in Q1). Measured per consumption unit, it slowed down to the same extent (+0.1% after +0.5%).
In Q2 2016, household consumption declined while their purchasing power improved, so that their savings ratio increased: 14.8% after 14.5%.

* This growth rate is seasonally and working-day adjusted; volumes are chain-linked previous-year-prices volumes.
tableauTab2 – Sectoral accounts
| 2015 Q3 | 2015 Q4 | 2016 Q1 | 2016 Q2 | 2015 | 2016 (ovhg) | |
|---|---|---|---|---|---|---|
| Profit ratio of NFC*(level) | 31.4 | 31.6 | 32.1 | 31.7 | 31.4 | |
| Household purchasing power | 0.8 | 0.5 | 0.6 | 0.2 | 1.6 | 1.6 |
- *NFC: non-financial corporations
- Source: INSEE
tableauTab3 – Production, consumption and GFCF: main components
| 2015 Q3 | 2015 Q4 | 2016 Q1 | 2016 Q2 | 2015 | 2016 (ovhg) | |
|---|---|---|---|---|---|---|
| Production of branches | 0.4 | 0.5 | 0.7 | -0.2 | 1.3 | 1.1 |
| Goods | 0.5 | 0.4 | 0.2 | -0.5 | 1.2 | 0.2 |
| Manufactured Industry | 0.5 | 0.6 | 0.1 | -0.9 | 1.5 | 0.0 |
| Construction | -0.5 | 0.5 | 0.2 | -0.7 | -2.2 | -0.3 |
| Market services | 0.5 | 0.7 | 1.0 | -0.1 | 1.8 | 1.7 |
| Non-market services | 0.3 | 0.4 | 0.4 | 0.3 | 1.0 | 1.1 |
| Household consumption | 0.5 | 0.0 | 1.1 | -0.1 | 1.5 | 1.3 |
| Food products | -0.1 | 0.4 | 0.4 | -0.8 | 1.2 | 0.2 |
| Energy | 2.1 | -2.5 | 1.8 | 1.6 | 1.4 | 1.5 |
| Engineered goods | 1.0 | 0.0 | 2.2 | 0.1 | 2.6 | 2.8 |
| Services | 0.4 | 0.3 | 0.8 | -0.2 | 1.0 | 1.1 |
| GFCF | 0.7 | 1.2 | 1.3 | -0.2 | 0.9 | 2.3 |
| Manufactured goods | 3.1 | 3.7 | 3.3 | 0.8 | 2.1 | 7.8 |
| Construction | -0.4 | 0.4 | 0.3 | -0.6 | -2.2 | -0.2 |
| Market services | 0.6 | 0.8 | 1.2 | -0.4 | 4.4 | 2.1 |
- Source: INSEE
tableauTab4 – Households' disposable income and ratios of households' account
| 2015 Q3 | 2015 Q4 | 2016 Q1 | 2016 Q2 | 2015 | 2016 (ovhg) | |
|---|---|---|---|---|---|---|
| HDI | 0.7 | 0.6 | 0.5 | 0.3 | 1.4 | 1.6 |
| Household purchasing power | 0.8 | 0.5 | 0.6 | 0.2 | 1.6 | 1.6 |
| HDI by cu* (purchasing power) | 0.7 | 0.4 | 0.5 | 0.1 | 1.2 | 1.2 |
| Adjusted HDI (purchasing power) | 0.7 | 0.5 | 0.6 | 0.3 | 1.6 | 1.5 |
| Saving rate (level) | 14.5 | 15.0 | 14.5 | 14.8 | 14.5 | |
| Financial saving rate (level) | 5.6 | 5.9 | 5.7 | 5.8 | 5.5 |
- *cu: consumption unit
- Source: INSEE
Non-financial corporations' profit ratio decreased by 0.4 points in Q2
In Q2 2016, non-financial corporations' profit ratio decreased slightly, from 32.1% to 31.7%. Indeed, apparent labour productivity stepped back in line with added value, and the rebound in the oil price deteriorated the terms of trade. Meanwhile, the decrease in the contributions for family allowance since April within the framework of the Pacte de responsabilité et de solidarité limited the overalldecrease.
tableauTab5 – Ratios of non-financial corporations' account
| 2015 Q3 | 2015 Q4 | 2016 Q1 | 2016 Q2 | 2015 | |
|---|---|---|---|---|---|
| Profit share | 31.4 | 31.6 | 32.1 | 31.7 | 31.4 |
| Investment ratio | 22.8 | 23.0 | 23.2 | 23.3 | 22.9 |
| Savings ratio | 20.0 | 20.0 | 21.3 | 20.6 | 19.7 |
| Self-financing ratio | 87.6 | 86.9 | 92.0 | 88.8 | 86.3 |
- Source: INSEE
In Q2, general government deficit decreased
In Q2 2016, general government net borrowing decreased by 0.2 GDP points and reached 3.2% of GDP (after 3.4%). Sales of 4G frequencies contributed for 0.1 GDP points to the decrease in the general government deficit.
Receipts bounced back in Q2 (+0.6% after −0.1%) thanks to dynamic corporation taxes. However, this rebound was moderated by the downturn in social contributions.
Expenditure slowed down in Q2 (+0.2% after +0.9%) after a dynamic first quarter when the French contribution to the European Union budget went back to normal.
tableauTab6 – Expenditure, receipts and net borrowing of public administrations
| 2015 Q3 | 2015 Q4 | 2016 Q1 | 2016 Q2 | 2015 | |
|---|---|---|---|---|---|
| In billions of euros | |||||
| Total expenditure | 311.4 | 310.5 | 313.3 | 313.9 | 1242.9 |
| Total receipts | 291.3 | 295.0 | 294.6 | 296.4 | 1166.4 |
| Net lending (+) or borrowing (-) | -20.1 | -15.4 | -18.6 | -17.5 | -76.5 |
| In % of GDP | |||||
| Net lending (+) or borrowing (-) | -3.7 | -2.8 | -3.4 | -3.2 | -3.5 |
- Source: INSEE
Revisions
The estimate of the GDP growth in Q2 2016 has been revised downwards, at −0.1% instead of 0.0% initially. This revision is mainly due to the integration of indicators not available for the second estimate, and to the updating of the seasonal adjustment parameters.
Avertissement
Quarterly national accounts
Quarterly debt of the general government
Sources
Quarterly national accounts
Quarterly accounts are a consistent set of indicators which provides a global overview of recent economic activity.
Time series of the main aggregates of quarterly national accounts can be accessed through the "Summary". They are classified into eight categories:
- Gross domestic product (GDP) and main economic aggregates ;
- Goods and services ;
- Households' consumption ;
- Foreign trade ;
- Activities ;
- Institutional sectors ;
- Households' income and purchasing power ;
- Public finances.
For each category, are available :
- synthetic files displaying from the accounts the relevant information for economic analysis ,
- sometimes, one or two files displaying all the data available.
Documentation
Abbreviated methodology (pdf, 140 Ko )
Methodology - First estimate at 30 days (pdf, 112 Ko )