


Quarterly national accounts in Q4 2014 National accounts in base 2010 - Detailed results
French GDP increased by 0.1% in Q4. Over the year, GDP rose by 0.4% Quarterly national accounts - second estimate - 4th Quarter 2014
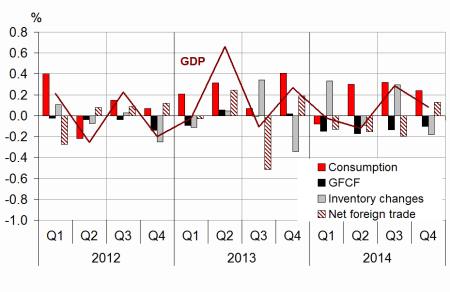
In Q4 2014, GDP in volume terms increased by 0.1%. Over the year, GDP rose by 0.4% as in 2013.
In Q4 2014, GDP in volume terms increased by 0.1%. Over the year, GDP rose by 0.4% as in 2013.
Household consumption expenditure increased slightly by the end of the year (+0.2% after +0.3% in Q3 2014). Conversely, total gross fixed capital formation (GFCF) still decreased (–0.5% after –0.6%). Thus, final domestic demand (excluding inventory changes) rose slightly and contributed for +0.1 points to GDP after +0.2 points in Q3. Exports accelerated markedly in Q4 (+2.3% after +0.7%), while imports kept on increasing (+1.7% after +1.3%). Ultimately, foreign trade balance contributed positively to activity: +0.1 points after –0.2 points. Conversely, changes in inventories contributed for –0.2 points, after +0.3 points the previous quarter.
Total production was flat
In Q4, production in goods and services held steady (after +0.5%). Output in the manufactured goods stepped back (–0.2% after +0.5%), notably production of transport equipment. At the same time, production of tradable services decelerated slightly but still increased (+0.4% after +0.6%) whereas activity in construction dropped again (–1.0% after –1.0%). Over the year, total production increased by 0.6%, after +0.5% in 2013: it renewed with growth in manufacturing industries (+0.4% after –0.6%) and accelerated slightly in tradable services (+1.2% after +0.9%), while the decline in construction intensified (–2.9% after –1.2%).
Investment dropped again
As from the beginning of the year, GFCF continued to decline this quarter (–0.5% after –0.6%). Investment in construction fell again, but less strongly in Q4 (–1.1% after –1.4%). Investment in manufactured goods decreased again (–0.3% after –0.1%).

* This growth rate is seasonally and working-day adjusted; volumes are chain-linked previous-year-prices volumes.
graphiqueGraph1 – GDP and its main components
tableauTab1 – Goods and services:supply and uses chain-linked volumes
| 2014 Q1 | 2014 Q2 | 2014 Q3 | 2014 Q4 | 2013 | 2014 | |
|---|---|---|---|---|---|---|
| GDP | 0.0 | -0.1 | 0.3 | 0.1 | 0.4 | 0.4 |
| Imports | 1.0 | 0.6 | 1.3 | 1.7 | 1.9 | 3.8 |
| Household consumption *expenditure | -0.3 | 0.4 | 0.3 | 0.2 | 0.3 | 0.6 |
| General government *consumption expenditure | 0.3 | 0.4 | 0.6 | 0.4 | 2.0 | 1.9 |
| GFCF | -0.7 | -0.8 | -0.6 | -0.5 | -0.8 | -1.6 |
| *of which Non-financial corporated and unincorporated enterprises | -0.5 | -0.3 | 0.0 | -0.2 | -0.6 | 0.3 |
| Households | -1.7 | -1.6 | -1.5 | -1.5 | -3.1 | -5.8 |
| General government | -0.3 | -1.3 | -1.5 | -0.2 | 1.1 | -2.1 |
| Exports | 0.6 | 0.1 | 0.7 | 2.3 | 2.4 | 2.7 |
| Contributions: | ||||||
| Internal demand excluding inventory changes | -0.2 | 0.1 | 0.2 | 0.1 | 0.4 | 0.4 |
| Inventory changes | 0.3 | -0.1 | 0.3 | -0.2 | -0.2 | 0.3 |
| Net foreign trade | -0.1 | -0.2 | -0.2 | 0.1 | 0.1 | -0.4 |
tableauTab2 – Sectoral accounts
| 2014 Q1 | 2014 Q2 | 2014 Q3 | 2014 Q4 | 2013 | 2014 (ovhg) | |
|---|---|---|---|---|---|---|
| Profit ratio of NFC* (level) | 30.0 | 29.5 | 29.6 | 29.8 | ||
| Household purchasing power | 0.6 | 0.5 | 0.6 | 0.0 | 1.2 |
- *NFC: non-financial corporations
tableauTab3 – Production, Consumption and GFCF: main components
| 2014 Q1 | 2014 Q2 | 2014 Q3 | 2014 Q4 | 2013 | 2014 | |
|---|---|---|---|---|---|---|
| Production of branches | 0.1 | -0.1 | 0.5 | 0.0 | 0.5 | 0.6 |
| Goods | 0.2 | -0.4 | 0.7 | -0.6 | -0.2 | 0.0 |
| Manufactured Industry | 0.7 | -0.8 | 0.5 | -0.2 | -0.6 | 0.4 |
| Construction | -1.3 | -1.3 | -1.0 | -1.0 | -1.2 | -2.9 |
| Market services | 0.2 | 0.1 | 0.6 | 0.4 | 0.9 | 1.2 |
| Non-market services | 0.4 | 0.3 | 0.5 | 0.3 | 1.5 | 1.6 |
| Household consumption | -0.3 | 0.4 | 0.3 | 0.2 | 0.3 | 0.6 |
| Food products | -0.9 | 0.8 | -0.3 | 0.7 | 0.1 | 0.4 |
| Energy | -4.7 | 1.8 | 1.2 | -2.3 | 0.8 | -5.7 |
| Engineered goods | 0.4 | -0.5 | 0.4 | 0.6 | -1.0 | 1.7 |
| Services | 0.1 | 0.2 | 0.2 | 0.3 | 0.6 | 0.7 |
| GFCF | -0.7 | -0.8 | -0.6 | -0.5 | -0.8 | -1.6 |
| Manufactured goods | -0.2 | -0.7 | -0.1 | -0.3 | -0.9 | 0.3 |
| Construction | -1.3 | -1.6 | -1.4 | -1.1 | -1.6 | -3.9 |
| Market services | -0.1 | 0.3 | 0.2 | 0.4 | 0.3 | 0.5 |
tableauTab4 – Households’ disposable income and ratios of households’ account
| 2014 Q1 | 2014 Q2 | 2014 Q3 | 2014 Q4 | 2013 | 2014 (ovhg) | |
|---|---|---|---|---|---|---|
| HDI | 1.1 | 0.5 | 0.5 | 0.6 | 1.6 | |
| Household purchasing power | 0.6 | 0.5 | 0.6 | 0.0 | 1.2 | |
| HDI by cu* (purchasing power) | 0.5 | 0.3 | 0.4 | -0.6 | 0.6 | |
| Adjusted HDI (purchasing power) | 0.6 | 0.5 | 0.6 | 0.5 | 1.3 | |
| Saving rate (level) | 15.4 | 15.5 | 15.8 | 15.1 | 0.0 | |
| Financial saving rate (level) | 6.3 | 6.6 | 6.9 | 5.8 | 0.0 |
- *cu: consumption unit
tableauTab5 – Ratios of non-financial corporations’ account
| 2014 Q1 | 2014 Q2 | 2014 Q3 | 2014 Q4 | 2013 | |
|---|---|---|---|---|---|
| Profit share | 30.0 | 29.5 | 29.6 | 29.8 | |
| Investment ratio | 22.6 | 22.6 | 22.6 | 22.6 | |
| Savings ratio | 17.1 | 17.2 | 17.2 | 17.1 | |
| Self-financing ratio | 75.6 | 75.8 | 76.2 | 75.8 |
tableauTab6 – Expenditure, receipts and net borrowing of public administrations
| 2014 Q1 | 2014 Q2 | 2014 Q3 | 2014 Q4 | 2013 | |
|---|---|---|---|---|---|
| In billions of euros | |||||
| Total expenditure | 307.4 | 308.3 | 310.3 | 1207.7 | |
| Total receipts | 285.8 | 284.7 | 286.3 | 1120.4 | |
| Net lending (+) or borrowing (-) | -21.6 | -23.6 | -24.0 | -87.2 | |
| In % of GDP | |||||
| Net lending (+) or borrowing (-) | -4.0 | -4.4 | -4.5 | -4.1 |
However, investment in tradable services was still growing (+0.4% this quarter after +0.2% in previous quarter). Over the year, GFCF stepped back: –1.6% after –0.8%.
Household consumption decelerated
In Q4 2014, household consumption grew by 0.2%, after +0.3% in Q3. Expenditure in goods decelerated (+0.1% after +0.3%). Total expenditure on energy, in particular gas and electricity, declined sharply (–2.3%) due to temperatures above their seasonal average. Conversely, consumption in food products bounced back (+0.7% after –0.3%) and household expenditure in capital goods were still dynamic (+2.9% after +3.0%). As for services, expenditure accelerated slightly (+0.3% after +0.2%). Over the year, household consumption expenditure accelerated (+0.6% after +0.3%). In 2014, consumption expenditure of general government progressed at a rate close to 2013 (+1.9% after +2.0% in 2013).
Foreign trade balance contributed anew to growth
In Q4, exportations accelerated markedly (+2.3% after +0.7%), especially in transport equipment (+10.7% after –5.0%). In the same time, importations were also more dynamic compared to the previous quarter (+1.7% after +1.3%), mainly due to importations of pharmaceuticals. Overall, the foreign trade balance contributed for +0.1 points this quarter after –0.2 points the previous quarter. Over the year, exportations increased (+2.7% after +2.4%), but less than importations (+3.8% after +1.9%). In 2014, the foreign trade balance weighed down GDP growth (–0.4 points after +0.1 points in 2013).
Changes in inventories weighed down GDP growth at the end of 2014
In Q4, changes in inventories accounted for –0.2 points of GDP growth after +0.3 points. In particular, the negative contribution concerned the transport equipment, in automotive as in aeronautics. Over the year, changes in inventories contributed up to +0.3 points, after –0.2 points in 2013.
Revisions
GDP growth in Q3 2014 is still estimated at +0.3%. Mild revisions are mainly imputable to revisions of indicators and to updates of seasonal adjustment coefficients.
Avertissement
Quarterly national accounts
Quarterly debt of the general government
Sources
Quarterly national accounts
Quarterly accounts are a consistent set of indicators which provides a global overview of recent economic activity.
Time series of the main aggregates of quarterly national accounts can be accessed through the "Summary". They are classified into eight categories:
- Gross domestic product (GDP) and main economic aggregates ;
- Goods and services ;
- Households' consumption ;
- Foreign trade ;
- Activities ;
- Institutional sectors ;
- Households' income and purchasing power ;
- Public finances.
For each category, are available :
- synthetic files displaying from the accounts the relevant information for economic analysis ,
- sometimes, one or two files displaying all the data available.
Documentation
Abbreviated methodology (pdf, 140 Ko )
Methodology - First estimate at 30 days (pdf, 112 Ko )