


Quarterly national accounts in Q1 2014 National accounts in base 2010 - Detailed results
In Q1 2014, French GDP held steady (0.0% after +0.2%), households’ purchasing power and corporations’ profit ratio picked up Quarterly national accounts - detailed figures - 1st Quarter 2014
In Q1 2014, French growth domestic product (GDP) in volume* held steady after a 0.2 percent increase in Q4 2013. The previous release (preliminary figures, on May 15, 2014) is globally unchanged.
In Q1 2014, French growth domestic product (GDP) in volume* held steady after a 0.2 percent increase in Q4 2013. The previous release (preliminary figures, on May 15, 2014) is globally unchanged.
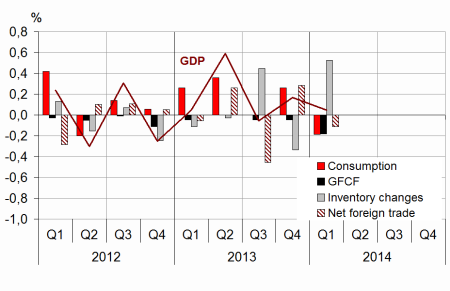
Households’ consumption expenditure declined (–0.5% after +0.2%) and the decrease of total gross fixed capital formation (GFCF) got sharper (–0.8% after –0.2%). All in all, final domestic demand (excluding changes in inventories) decreased anew and contributed negatively to GDP evolution in Q1 (–0.4 points after +0.2 points in Q4 2013).
Imports accelerated (+1.0% after +0.5%), while exports decelerated (+0.6% after +1.5%). Consequently, the foreign trade balance contributed negatively to activity (–0.1 points after +0.3 points). On the contrary, changes in inventories contributed positively (+0.5 points after –0.3 points).
Households’ purchasing power rebounded
In nominal terms, household’s gross disposable income (GDI) upturned in Q1 (+1.3% after –0.3%). Indeed, taxes on income and wealth markedly decreased (–4.1%) following a strong H2 2013 (+1.7% in 2013 Q3 and +5.1% in Q4). This progress resulted notably from measures adopted to enhance the efficiency of taxes in 2013: the de-indexation of the income tax thresholds, the creation of a 45% bracket and the lowering of the family quotient ceiling. Moreover, wages received by households increased at the same rate as at the end of 2013 (+0.5%) and social benefits decelerated slightly (+0.7% after +0.8%).
graphiqueGraph1 – GDP and its main components
tableauTab1 – Goods and services:supply and uses chain-linked volumes
| 2013 Q2 | 2013 Q3 | 2013 Q4 | 2014 Q1 | 2013 | 2014 (ovhg) | |
|---|---|---|---|---|---|---|
| GDP | 0.6 | -0.1 | 0.2 | 0.0 | 0.4 | 0.3 |
| Imports | 1.9 | 1.1 | 0.5 | 1.0 | 1.9 | 2.3 |
| Household consumption *expenditure | 0.3 | -0.2 | 0.2 | -0.5 | 0.3 | -0.4 |
| General government's *consumption expenditure | 0.8 | 0.3 | 0.5 | 0.4 | 2.0 | 1.1 |
| GFCF | 0.0 | -0.2 | -0.2 | -0.8 | -0.8 | -1.1 |
| *of which Non financial corporated and unincorporated enterprises | 0.3 | 0.2 | 0.7 | -0.6 | -0.6 | 0.2 |
| Households | -0.6 | -1.7 | -2.3 | -2.4 | -3.1 | -5.1 |
| General government | 0.1 | 0.6 | -0.3 | 0.0 | 1.1 | 0.1 |
| Exports | 3.0 | -0.5 | 1.5 | 0.6 | 2.4 | 2.3 |
| Contributions : | ||||||
| Internal demand excluding inventory changes | 0.4 | 0.0 | 0.2 | -0.4 | 0.5 | -0.1 |
| Inventory changes | 0.0 | 0.4 | -0.3 | 0.5 | -0.2 | 0.5 |
| Net foreign trade | 0.3 | -0.5 | 0.3 | -0.1 | 0.1 | -0.1 |
tableauTab2 – Sectoral accounts
| 2013 Q2 | 2013 Q3 | 2013 Q4 | 2014 Q1 | 2013 | 2014 (ovhg) | |
|---|---|---|---|---|---|---|
| Profit ratio of NFC* (level) | 30.1 | 29.4 | 29.5 | 30.0 | 29.8 | |
| Household purchasing power | 0.3 | -0.2 | -0.3 | 0.9 | 0.0 | 0,6 |
- *NFC: non-financial corporations
tableauTab3 – Production, Consumption and GFCF : main componants
| 2013 Q2 | 2013 Q3 | 2013 Q4 | 2014 Q1 | 2013 | 2014 (ovhg) | |
|---|---|---|---|---|---|---|
| Production of branches | 0.9 | -0.2 | 0.2 | 0.2 | 0.5 | 0.5 |
| Goods | 1.4 | -1.2 | -0.2 | 0.5 | -0.2 | 0.1 |
| Manufactured Industry | 1.6 | -1.1 | 0.0 | 0.9 | -0.6 | 0.8 |
| Construction | 0.3 | -0.5 | -0.4 | -1.4 | -1.2 | -1.8 |
| Market services | 0.7 | 0.2 | 0.4 | 0.2 | 0.9 | 0.8 |
| Non-market services | 0.7 | 0.2 | 0.4 | 0.4 | 1.5 | 1.0 |
| Household consumption | 0.3 | -0.2 | 0.2 | -0.5 | 0.3 | -0.4 |
| Food products | -0.8 | 0.3 | 0.9 | -0.9 | 0.1 | -0.3 |
| Energy | 1.3 | -3.8 | -1.4 | -3.9 | 0.8 | -6.4 |
| Engineered goods | 0.1 | 0.7 | 1.2 | 0.0 | -1.0 | 1.3 |
| Services | 0.4 | 0.1 | 0.1 | 0.2 | 0.6 | 0.4 |
| GFCF | 0.0 | -0.2 | -0.2 | -0.8 | -0.8 | -1.1 |
| Manufactured goods | -0.7 | 1.2 | 0.3 | -0.5 | -0.9 | 0.1 |
| Construction | 0.0 | -0.8 | -0.8 | -1.6 | -1.6 | -2.5 |
| Services | 0.5 | -0.3 | 0.3 | 0.0 | 0.3 | 0.3 |
tableauTab4 – Households’ disposable income and ratios of households’ account
| 2013 Q2 | 2013 Q3 | 2013 Q4 | 2014 Q1 | 2013 | 2014 (ovhg) | |
|---|---|---|---|---|---|---|
| HDI | 0.2 | 0.0 | -0.3 | 1.3 | 0.6 | 1.1 |
| Household purchasing power | 0.3 | -0.2 | -0.3 | 0.9 | 0.0 | 0.6 |
| HDI by cu* (purchasing power) | 0.1 | -0.4 | -0.5 | 0.7 | -0.6 | 0.2 |
| Adjusted HDI (purchasing power) | 0.4 | -0.1 | -0.1 | 0.8 | 0.5 | 0.7 |
| Saving rate (level) | 15.2 | 15.1 | 14.7 | 15.9 | 15.1 | |
| Financial saving rate (level) | 5.8 | 6.0 | 5.6 | 7.1 | 5.8 |
- *cu: consumption unit
tableauTab5 – Ratios of non-financial corporations’ account
| 2013 Q2 | 2013 Q3 | 2013 Q4 | 2014 Q1 | 2013 | |
|---|---|---|---|---|---|
| Profit share | 30.1 | 29.4 | 29.5 | 30.0 | 29.8 |
| Investment ratio | 22.4 | 22.6 | 22.7 | 22.5 | 22.6 |
| Savings ratio | 17.4 | 16.6 | 17.2 | 17.2 | 17.1 |
| Self-financing ratio | 77.7 | 73.4 | 75.9 | 76.5 | 75.7 |
tableauTab6 – Expenditure, receipts and net borrowing of public administrations
| 2013 Q2 | 2013 Q3 | 2013 Q4 | 2014 Q1 | 2013 | |
|---|---|---|---|---|---|
| In billions of euros | |||||
| Total expenditure | 300.5 | 303.4 | 305.4 | 308.6 | 1208.3 |
| Total receipts | 278.5 | 281.2 | 283.1 | 284.9 | 1118.7 |
| Net lending (+) or borrowing (-) | -22.0 | -22.2 | -22.3 | -23.7 | -89.6 |
| In % of GDP | |||||
| Net lending (+) or borrowing (-) | -4.2 | -4.2 | -4.2 | -4.4 | -4.2 |
Consumption prices moderately increased in Q1 (+0.3% after +0.1%), therefore households’ purchasing power rose by 0.9% in Q1 2014 after a step back at the end of 2013 (–0.3%). Taken individually (measured per consumption unit), it increased by 0.7% after a 0.5% drop in Q4 2013.
As households’ consumption decreased (–0.2% in value after +0.3%), the saving ratio increased: it reached 15.9%, its 2012 spring level, after 14.7% at the end of 2013.
Non-financial corporations’ profit ratio sharply recovered in Q1 2014
In Q1 2014, non-financial corporations’ nominal value added decelerated (+0.1% after +0.3%) and compensations (including social contributions and taxes on labour) accelerated: +0.8% after +0.3%. However their profit ratio upturned by 0.5 points to reach 30.0%. It was the most important increase since the beginning of 2010. It resulted from the implementation of the CICE: this tax credit, recorded as a subsidy (receipt for corporations, expenditure for public administrations) contributed for +1.1 points to the profit ratio increase.
In Q1 2014, General government deficit represented 4.4% of GDP
General government deficit reached 4.4% in Q1 2014. Expenditure accelerated (+1.0% after +0.6%), the impact of the CICE is partly offset by a decrease of the French contribution to the European budget. The receipts increase was steady at +0.7%: the households’ taxes on income decline was offset by increases in taxes on societies, in VAT (because of rate increases) and in social contributions. The quarterly general government deficit estimation results from methodological works which spanned several years. It is not merely accounting data but statistical data which contains some imprecisions and may be revised (see methodology note). The resulting volatility of these agregates should encourage great caution when using and interpreting these estimates, particularly concerning quarters of the current year.
Avertissement
Quarterly national accounts
Quarterly debt of the general government
Sources
Quarterly national accounts
Quarterly accounts are a consistent set of indicators which provides a global overview of recent economic activity.
Time series of the main aggregates of quarterly national accounts can be accessed through the "Summary". They are classified into eight categories:
- Gross domestic product (GDP) and main economic aggregates ;
- Goods and services ;
- Households' consumption ;
- Foreign trade ;
- Activities ;
- Institutional sectors ;
- Households' income and purchasing power ;
- Public finances.
For each category, are available :
- synthetic files displaying from the accounts the relevant information for economic analysis ,
- sometimes, one or two files displaying all the data available.
Documentation
Abbreviated methodology (pdf, 140 Ko )
Methodology - First estimate at 30 days (pdf, 112 Ko )