

 148,000 Britons Live in France, Especially in the Sparsely Populated Areas of the
West
148,000 Britons Live in France, Especially in the Sparsely Populated Areas of the
West
In 2016, there were 148,300 Britons living in France. They arrived in particularly large numbers between 1990 and 2006, a period during which their population doubled. In 2016, 53,000 British residents, i.e. over a third, were retired. The majority of these Britons are couples, without children, and live in the sparsely populated areas of western France such as Charente, Dordogne or Haute-Vienne. 55,000 Britons residing in France are in employment. They live mainly in large cities offering skilled jobs The Alps and some of the border regions are also home to expats, who are relatively young and mostly come to work. UK residents also choose France as a tourist destination, where they own 86,000 second homes and constitute one of the country’s main foreign tourist client groups.
- France: the Second Most Popular European Country for British Nationals
- Britons More Often Settle in the Least Populated Regions
- A Steady Rhythm of People Arriving in the 2000s, Which Has Since Started to Slow
- The Sparsely Populated Living Areas of Western France are Home to British Retirees
- Britons in Employment Primarily Present in Large Cities
- Britons in Employment also Living in Border or Alpine Tourist Regions
- Box 1 - In the Future, Will There Be More Britons Applying for French Nationality?
- Box 2 - France: Also a Tourist Destination for UK Residents
France: the Second Most Popular European Country for British Nationals
In 2016, there were 148,300 Britons living in France (Box 1), making France the second most popular European country for British nationals. The most popular, Spain, has twice as many British residents. Britons represent 0.2% of the French population. They are the 4th most populous group of European residents living in French territory, far behind the Portuguese (546,100 inhabitants), followed by the Italians (194,600 inhabitants) and the Spanish (157,400 inhabitants), whose immigration to France began earlier. The Northern European nationalities, such as the Belgians, the Germans or the Dutch, are less represented. The foreign population is more concentrated than the population as a whole, but with location rationales differing from one nationality to another.
Britons More Often Settle in the Least Populated Regions
In search of a less urbanised living environment and more affordable property prices than in their home nation, some Britons choose to settle in France’s least populated areas (Figure 1). In this respect, they differ from the Belgians and Germans who prefer the more urbanised border areas (Figure 2).
For example, 19% of these British people live in very sparesely populated communes compared with 9% of Belgians and 5% of Germans. 20% of Dutch nationals also live in communes of this type, but their population only numbers a quarter as many people.
British residents are especially concentrated in a vast area that stretches from Haute-Vienne to Gers, encompassing Charente and Dordogne. For example, 43% of British residents who have settled in France live in Nouvelle-Aquitaine or in Occitanie (39,200 and 24,900 people, respectively). There are also greater numbers of Britons in Brittany and south-west Normandy, areas that are closer to the English coasts, or even in some areas of Savoie and Haute-Savoie.
These regional preferences can also be seen among British owners of second homes in France. Purchasing a second home may be the precursor to some of these people settling in France permanently (Box 2).
tableauFigure 1 - Breakdown and Share of Britons in the Population by Living Area in 2016
| Number of Britons |
Share of Britons in the population (%) | ||
|---|---|---|---|
| 74 | Morzine | 794 | 9.3 |
| 87 | Le Dorat | 794 | 9.3 |
| 24 | Eymet | 851 | 9.0 |
| 79 | Sauzé-Vaussais | 461 | 8.1 |
| 22 | Callac | 602 | 7.8 |
| 86 | Civray | 925 | 7.1 |
| 29 | Huelgoat | 525 | 6.8 |
| 79 | Chef-Boutonne | 460 | 6.6 |
| 16 | Confolens | 714 | 6.5 |
| 87 | Rochechouart | 922 | 6.4 |
| 86 | L'Isle-Jourdain | 375 | 6.3 |
| 16 | Chabanais | 471 | 6.2 |
| 47 | Castillonnès | 407 | 5.7 |
| 16 | Chalais | 615 | 5.6 |
| 24 | Nontron | 838 | 5.2 |
| 87 | Châlus | 446 | 5.2 |
| 16 | Ruffec | 959 | 5.1 |
| 56 | Guémené-sur-Scorff | 627 | 5.1 |
| 74 | Chamonix-Mont-Blanc | 602 | 5.0 |
| 16 | Chasseneuil-sur-Bonnieure | 449 | 4.8 |
| 24 | Ribérac | 1,223 | 4.8 |
| 16 | Montbron | 417 | 4.7 |
| 22 | Rostrenen | 945 | 4.7 |
| 53 | Gorron | 340 | 4.7 |
| 47 | Villeréal | 221 | 4.4 |
| 31 | Boulogne-sur-Gesse | 381 | 4.3 |
| 50 | Mortain-Bocage | 422 | 4.1 |
| 47 | Monflanquin | 268 | 4.0 |
| 87 | Eymoutiers | 209 | 4,0 |
| 53 | Ambrières-les-Vallées | 276 | 3.9 |
| 16 | Terres-de-Haute-Charente | 208 | 3.8 |
| 16 | Mansle | 399 | 3.7 |
| 73 | Bozel | 246 | 3.7 |
| 17 | Aulnay | 233 | 3.6 |
| 1 | Divonne-les-Bains | 356 | 3.5 |
| 46 | Montcuq | 317 | 3.5 |
| 61 | Domfront en Poiraie | 432 | 3.5 |
| 11 | Espéraza | 266 | 3.4 |
| 47 | Miramont-de-Guyenne | 399 | 3.4 |
| 86 | Couhé | 313 | 3.4 |
| 86 | Montmorillon | 434 | 3.4 |
| 87 | Bellac | 584 | 3.4 |
- Source: INSEE, 2016 population census, main processing, excluding Mayotte, 2017 census.
graphiqueFigure 1 - Breakdown and Share of Britons in the Population by Living Area in 2016
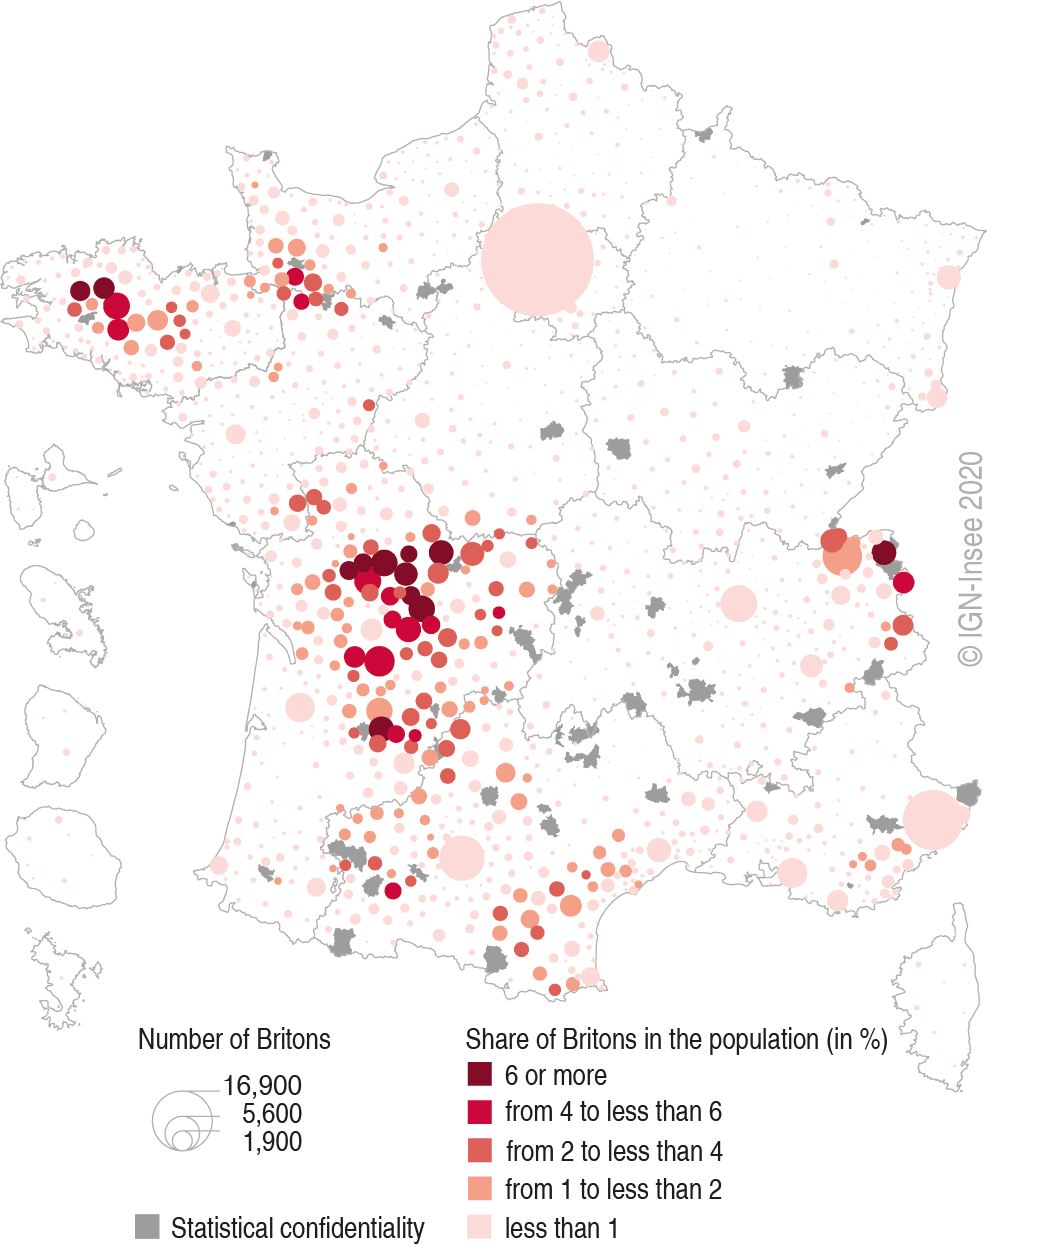
- * Statistical confidentiality: living areas with fewer than 5,000 inhabitants.
- Source: INSEE, 2016 population census, main processing, excluding Mayotte, 2017 census.
A Steady Rhythm of People Arriving in the 2000s, Which Has Since Started to Slow
This presence of the British community in France is the result of migratory movements that began at the end of the 20th century. In 1990, there were 65,300 Britons living in France. 26 years later, this number had more than doubled (Figure 3).
The phenomenon grew and spread geographically, especially between 1999 and 2006. During that period, the number of British people rose by 5.5% per year, which translates into an annual increase of 6,100 people on average. The new arrivals tended to head to the more sparsely populated areas (Figure 4).
This period coincided with a sharp rise in property prices in the UK, making access to property more difficult. Other British households saw an opportunity to sell their property in the UK at a high price and acquire both a home and a better quality of life abroad. Developments in low-cost air transport helped this movement. Regular flights between France and the UK tripled between 1996 and 2007. The Channel tunnel also entered into operation at the beginning of this period.
However, at the end of the 2000s, this movement began to slow. The fall in the British currency (– 20% against the euro between 2006 and 2011) reduced the purchasing power of the retirees who had settled in France, whose pensions were in pound sterling. This may partly explain why fewer Britons came to live in France. Over the more recent period from 2011 to 2016, their number dropped by 1.2% per year, or 1,900 fewer inhabitants on average each year. At the same time, fewer British people acquired French nationality. Indeed, in 2016, 78% of the Britons present in France had moved to the country less than 20 years ago.
The British residents in France have quite varied profiles, with characteristics specific to their place of residence. These areas can be broken down into five distinct groups.
tableauFigure 2 - Breakdown of Foreign Nationals by Living Area in 2016
| Dutch | Belgians | Germans | Britons | ||
|---|---|---|---|---|---|
| 75 | Paris | 4,861 | 11,876 | 15,946 | 16,855 |
| 6 | Nice | 1,143 | 3,065 | 2,057 | 4,796 |
| 31 | Toulouse | 461 | 1,053 | 2,553 | 2,698 |
| 67 | Strasbourg | 220 | 638 | 3,954 | 765 |
| 59 | Lille | 509 | 3,660 | 659 | 616 |
| 69 | Lyon | 501 | 1,282 | 1,715 | 1,789 |
| 57 | Forbach | 20 | 25 | 4,807 | < 20 |
| 13 | Marseille - Aix-en-Provence | 522 | 1,648 | 1,433 | 1,186 |
| 74 | Annemasse | 471 | 890 | 1,159 | 2,059 |
| 67 | Seltz | < 20 | < 20 | 3,096 | < 20 |
| 33 | Bordeaux | 286 | 789 | 795 | 1,143 |
| 59 | Maubeuge | < 20 | 2,851 | 25 | < 20 |
| 84 | Avignon | 372 | 1,323 | 547 | 611 |
| 57 | Sarreguemines | < 20 | 21 | 2,794 | 21 |
| 68 | Saint-Louis | 117 | 108 | 1,850 | 550 |
| 34 | Montpellier | 202 | 858 | 720 | 772 |
| 38 | Grenoble | 194 | 470 | 954 | 696 |
| 59 | Valenciennes | 27 | 1,882 | 128 | 77 |
| 54 | Longwy | < 20 | 1,647 | 35 | 21 |
| 68 | Neuf-Brisach | < 20 | 23 | 1,618 | < 20 |
| 67 | Haguenau | 43 | 47 | 1,318 | 46 |
| 83 | Draguignan | 205 | 683 | 211 | 335 |
| 24 | Ribérac | 137 | 66 | < 20 | 1,223 |
| 55 | Stenay | 53 | 1,317 | < 20 | < 20 |
| 24 | Bergerac | 102 | 216 | 58 | 909 |
| 57 | Bouzonville | < 20 | < 20 | 1,241 | < 20 |
| 66 | Perpignan | 215 | 491 | 194 | 337 |
| 59 | Bavay | < 20 | 1.12 | < 20 | < 20 |
| 24 | Nontron | 133 | 60 | 46 | 838 |
| 57 | Creutzwald | < 20 | < 20 | 1,064 | < 20 |
| 22 | Rostrenen | 43 | 32 | < 20 | 945 |
| 16 | Ruffec | 20 | 29 | < 20 | 959 |
| 87 | Rochechouart | 59 | < 20 | 22 | 922 |
| 86 | Civray | 23 | 28 | < 20 | 925 |
| 24 | Eymet | 32 | 56 | 24 | 851 |
| 8 | Givet | < 20 | 938 | < 20 | < 20 |
| 54 | Longuyon | < 20 | 891 | < 20 | 21 |
| 58 | Château-Chinon (Ville) | 180 | 28 | < 20 | 34 |
- < 20: headcount less than 20.
- Source: INSEE, 2016 population census, excluding Mayotte, 2017 census
graphiqueFigure 2 - Breakdown of Foreign Nationals by Living Area in 2016
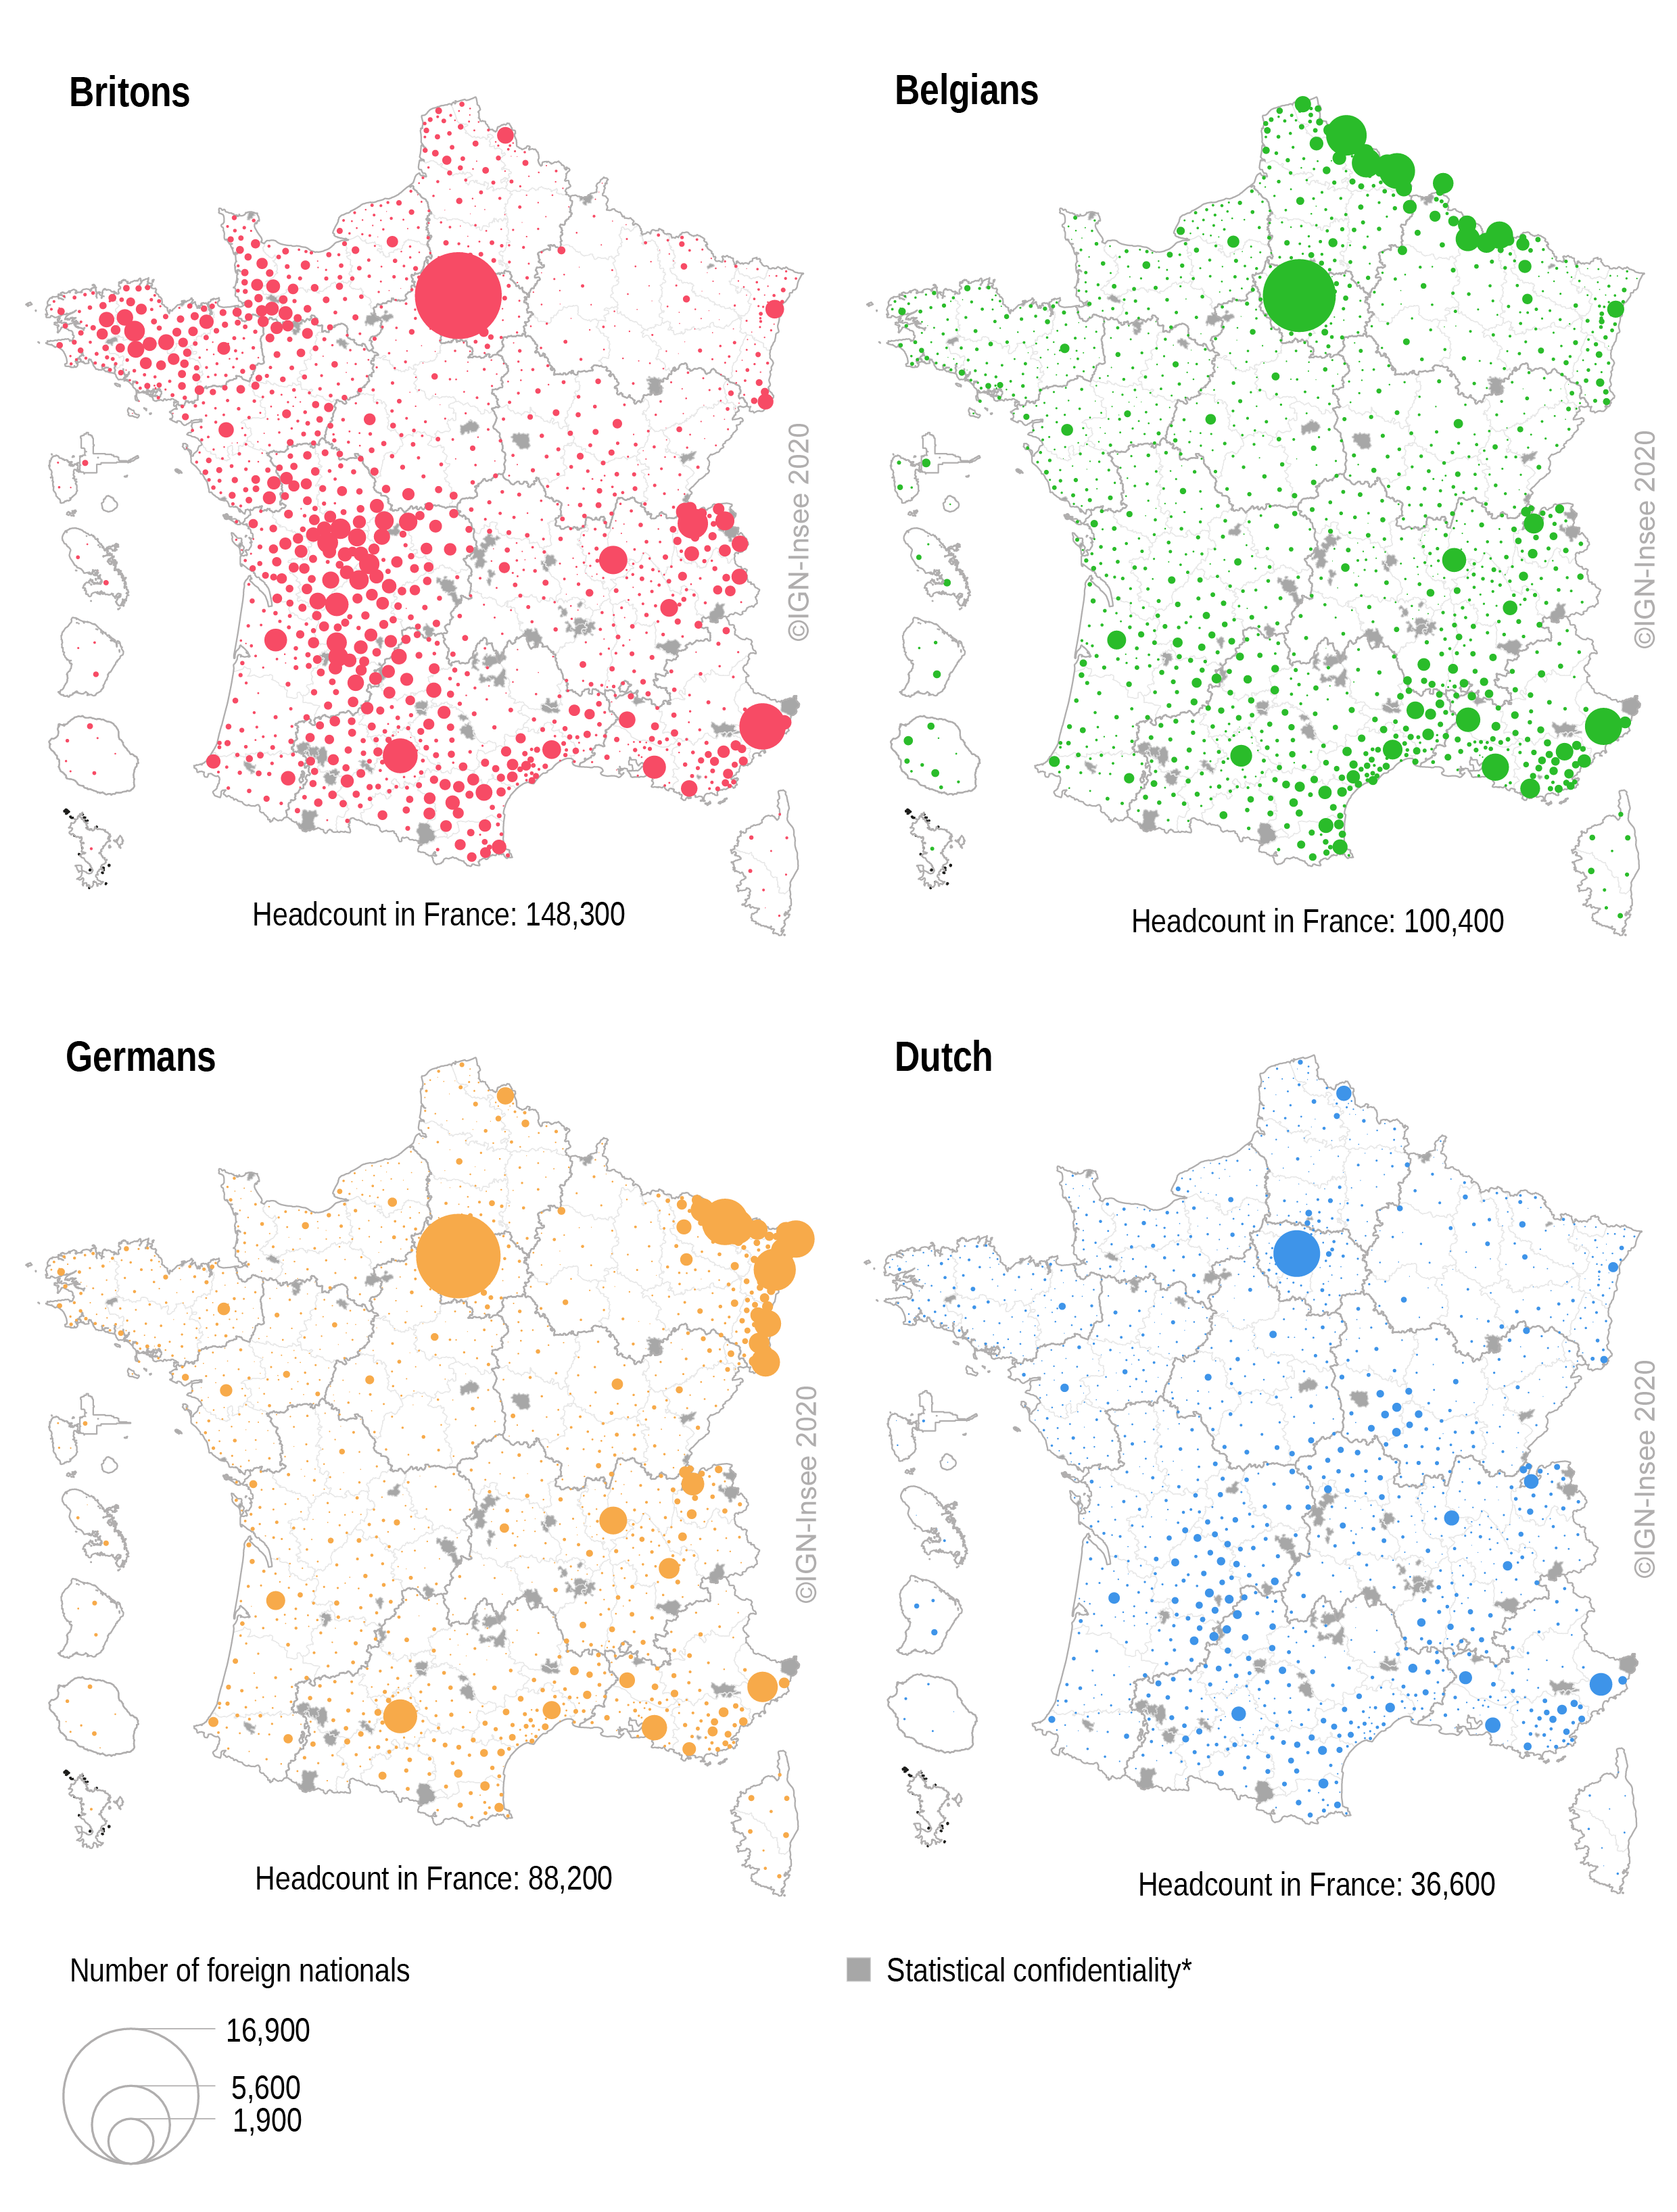
- * Statistical confidentiality: living areas with fewer than 5,000 inhabitants.
- Source: INSEE, 2016 population census, excluding Mayotte, 2017 census
The Sparsely Populated Living Areas of Western France are Home to British Retirees
In 2016, there were 53,000 Britons living in France, the majority of whom reside outside of large agglomerations, preferring the most sparsely populated areas in the western half of the country (Figure 5). 56% of the Britons living in these living areas (groups A and B) are retired (Figure 6). In some places in the south west, for example Condom (Gers), Prades (Pyrénées Orientales) or Valence (Tarn-et-Garonne), more than two thirds are retired. This lifestyle choice is often made by couples, with 59% of Britons in these two groups of living areas (groups A and B) living as a couple, without children, and 86% of those with a partner who is also British.
There are 32,700 Britons in the least populated living areas (group A), 16 times more than in 1990. These are the areas where the growth in the number of Britons was highest (+ 11.2% per year on average between 1990 and 2016, compared with + 3.2% across France as a whole). These areas are situated in central France (Creuse, Haute-Vienne, south part of Vienne, south part of Indre, north part of Charente, Dordogne), central Brittany or the south of Normandy (Figure 5), where property remain relatively affordable. The British residents in these areas are almost all owners (92%) of their main residence, which is almost always a house.
During the 2000s, low-cost air routes were opened, departing from small regional airports such as those of Limoges or Bergerac. This increased the attractiveness of these areas for households on lower incomes than those that made up the first waves of British migrants. It also made it possible to expand flight routes to more areas of the UK. Therefore, for around 20 years, more and more Britons have been settling in these areas, among the most sparsely populated in France. Half of the residents in the least populated areas (group A) have been living in France for less than 10 years, and now represent, on average, 3% of the population in this group of living areas and sometimes between 8 and 9% of inhabitants, such as in the living areas of Callac (Côtes-d’Armor) or Dorat (Haute-Vienne). The presence of British nationals contributes to the life of these sparsely populated areas (11,500 inhabitants on average) and often helps to support businesses and build up pupil numbers in the communes where these families live.
In this same west part of France, 35,000 Britons live in more populated living areas (group B), with on average 30,000 inhabitants (Figure 5). Their presence in these areas is less pronounced than in the areas of group A: they represent less than 1% of inhabitants. Their settling in these areas also tends to date back further, with 62% having lived there for more than 10 years. Among the retired Britons, who make up the largest proportion of this group, one in two were managers or in mid-level professions whereas this proportion is only one in four among the retired population residing in these living areas as a whole.
However, in the largest of these living areas, a slightly higher proportion of British residents are in employment, for example in Béziers, Draguignan, Cognac or Agen, where 30% to 40% work. In addition, families with children are a little more common here.
tableauFigure 3 - Number of Britons Broken Down by Type of Living Area since 1990
| 1990 | 1999 | 2006 | 2011 | 2016 | |
|---|---|---|---|---|---|
| A - Sparsely populated or very sparsely populated areas, with a majority of retired British people and high British presence | 2,100 | 7,000 | 25,600 | 33,200 | 32,700 |
| B - Sparsely or moderately populated areas, with a majority of retired British people | 6,600 | 14,100 | 32,900 | 38,100 | 34,900 |
| C - Large agglomerations, with British people in employment or students in particular | 37,500 | 43,700 | 38,800 | 40,700 | 38,300 |
| D - Border areas, with British people working abroad | 3,000 | 3,500 | 4,600 | 5,800 | 5,700 |
| E - Alpine tourist areas, with younger British people in employment | 300 | 1,000 | 1,900 | 2,900 | 3,400 |
| F - Other areas (fewer than 100 British people) | 15,800 | 25,100 | 33,300 | 37,000 | 33,300 |
| Total | 65,300 | 94,400 | 137,100 | 157,800 | 148,200 |
- Note: groups from one typology created using living areas comprising at least 100 British people (Figure 5).
- Coverage: France excluding Mayotte.
- Source: INSEE, 1990-2016, population censuses, main processing.
graphiqueFigure 3 - Number of Britons Broken Down by Type of Living Area since 1990

- Note: groups from one typology created using living areas comprising at least 100 British people (Figure 5).
- Coverage: France excluding Mayotte.
- Source: INSEE, 1990-2016, population censuses, main processing.
tableauFigure 4 - Changes in the Share of Britons in the Population
| 1990 | 1999 | 2006 | 2011 | 2016 | ||||||
|---|---|---|---|---|---|---|---|---|---|---|
| Number of Britons | Share of Britons in the population (%) | Number of Britons | Share of Britons in the population (%) | Number of Britons | Share of Britons in the population (%) | Number of Britons | Share of Britons in the population (%) | Number of Britons | Share of Britons in the population (%) | |
| Ain | 1,844 | 0.39 | 2,153 | 0.42 | 2,474 | 0.44 | 2,981 | 0.49 | 3,036 | 0.48 |
| Aisne | 96 | 0.02 | 166 | 0.03 | 162 | 0.03 | 173 | 0.03 | 158 | 0.03 |
| Allier | 188 | 0.05 | 270 | 0.08 | 387 | 0.11 | 434 | 0.13 | 418 | 0.12 |
| Alpes-de-Haute-Provence | 124 | 0.09 | 173 | 0.12 | 253 | 0.16 | 326 | 0.20 | 340 | 0.21 |
| Hautes-Alpes | 20 | 0.02 | 148 | 0.12 | 196 | 0.15 | 274 | 0.20 | 261 | 0.18 |
| Alpes-Maritimes | 4,669 | 0.48 | 4,677 | 0.46 | 5,893 | 0.55 | 6,000 | 0.55 | 5,256 | 0.49 |
| Ardèche | 280 | 0.1 | 295 | 0.10 | 284 | 0.09 | 360 | 0.11 | 323 | 0.10 |
| Ardennes | 60 | 0.02 | 45 | 0.02 | 39 | 0.01 | 49 | 0.02 | 39 | 0.01 |
| Ariège | 124 | 0.09 | 275 | 0.20 | 747 | 0.51 | 1,003 | 0.66 | 948 | 0.62 |
| Aube | 108 | 0.04 | 114 | 0.04 | 71 | 0.02 | 102 | 0.03 | 82 | 0.03 |
| Aude | 668 | 0.22 | 1,050 | 0.34 | 3,072 | 0.90 | 3,699 | 1.03 | 3,419 | 0.93 |
| Aveyron | 101 | 0.04 | 303 | 0.11 | 728 | 0.27 | 911 | 0.33 | 874 | 0.31 |
| Bouches-du-Rhône | 1,744 | 0.1 | 2,117 | 0.12 | 1,708 | 0.09 | 1,738 | 0.09 | 1,695 | 0.08 |
| Calvados | 640 | 0.1 | 984 | 0.15 | 1,545 | 0.23 | 1,572 | 0.23 | 1,439 | 0.21 |
| Cantal | 48 | 0.03 | 75 | 0.05 | 110 | 0.07 | 161 | 0.11 | 175 | 0.12 |
| Charente | 372 | 0.11 | 1,389 | 0.41 | 5,083 | 1.46 | 6,356 | 1.80 | 6,220 | 1.76 |
| Charente-Maritime | 484 | 0.09 | 1,085 | 0.19 | 3,044 | 0.51 | 3,456 | 0.55 | 3,002 | 0.47 |
| Cher | 152 | 0.05 | 210 | 0.07 | 273 | 0.09 | 341 | 0.11 | 329 | 0.11 |
| Corrèze | 128 | 0.05 | 296 | 0.13 | 801 | 0.33 | 1,256 | 0.52 | 1,206 | 0.50 |
| Côte-d'Or | 300 | 0.06 | 453 | 0.09 | 587 | 0.11 | 705 | 0.13 | 681 | 0.13 |
| Côtes-d'Armor | 436 | 0.08 | 1,494 | 0.28 | 4,508 | 0.79 | 5,174 | 0.87 | 4,566 | 0.76 |
| Creuse | 64 | 0.05 | 232 | 0.19 | 1,428 | 1.16 | 2,176 | 1.78 | 2,107 | 1.76 |
| Dordogne | 1,492 | 0.39 | 2,863 | 0.74 | 6,324 | 1.57 | 7,446 | 1.79 | 7,198 | 1.74 |
| Doubs | 200 | 0.04 | 214 | 0.04 | 150 | 0.03 | 132 | 0.02 | 168 | 0.03 |
| Drôme | 216 | 0.05 | 445 | 0.10 | 557 | 0.12 | 522 | 0.11 | 533 | 0.10 |
| Eure | 316 | 0.06 | 487 | 0.09 | 577 | 0.10 | 588 | 0.10 | 494 | 0.08 |
| Eure-et-Loir | 208 | 0.05 | 308 | 0.08 | 279 | 0.07 | 302 | 0.07 | 249 | 0.06 |
| Finistère | 404 | 0.05 | 1,067 | 0.13 | 1,964 | 0.22 | 2,312 | 0.26 | 2,197 | 0.24 |
| Corse-du-Sud | 156 | 0.13 | 83 | 0.07 | 77 | 0.06 | 71 | 0.05 | 58 | 0.04 |
| Haute-Corse | 140 | 0.11 | 140 | 0.10 | 99 | 0.06 | 118 | 0.07 | 85 | 0.05 |
| Gard | 712 | 0.12 | 869 | 0.14 | 1,186 | 0.17 | 1,402 | 0.20 | 1,233 | 0.17 |
| Haute-Garonne | 1,368 | 0.15 | 2,393 | 0.23 | 3,435 | 0.29 | 3,907 | 0.31 | 3,957 | 0.29 |
| Gers | 424 | 0.24 | 907 | 0.53 | 2,150 | 1.19 | 2,630 | 1.39 | 2,435 | 1.28 |
| Gironde | 1,224 | 0.1 | 1,754 | 0.14 | 2,085 | 0.15 | 2,528 | 0.17 | 2,606 | 0.17 |
| Hérault | 1,032 | 0.13 | 2,069 | 0.23 | 3,141 | 0.31 | 3,508 | 0.33 | 3,465 | 0.31 |
| Ille-et-Vilaine | 596 | 0.07 | 1,258 | 0.14 | 1,782 | 0.19 | 1,819 | 0.18 | 1,734 | 0.16 |
| Indre | 116 | 0.05 | 198 | 0.09 | 802 | 0.34 | 1,031 | 0.45 | 940 | 0.42 |
| Indre-et-Loire | 352 | 0.07 | 650 | 0.12 | 760 | 0.13 | 981 | 0.17 | 878 | 0.14 |
| Isère | 1,124 | 0.11 | 1,846 | 0.17 | 1,546 | 0.13 | 1,771 | 0.15 | 1,485 | 0.12 |
| Jura | 76 | 0.03 | 99 | 0.04 | 138 | 0.05 | 163 | 0.06 | 161 | 0.06 |
| Landes | 132 | 0.04 | 315 | 0.10 | 632 | 0.17 | 866 | 0.22 | 786 | 0.19 |
| Loir-et-Cher | 144 | 0.05 | 228 | 0.07 | 275 | 0.08 | 317 | 0.10 | 304 | 0.09 |
| Loire | 188 | 0.03 | 304 | 0.04 | 290 | 0.04 | 341 | 0.05 | 277 | 0.04 |
| Haute-Loire | 44 | 0.02 | 108 | 0.05 | 144 | 0.07 | 168 | 0.07 | 164 | 0.07 |
| Loire-Atlantique | 560 | 0.05 | 1,069 | 0.09 | 1,287 | 0.10 | 1,297 | 0.10 | 1,230 | 0.09 |
| Loiret | 312 | 0.05 | 423 | 0.07 | 329 | 0.05 | 292 | 0.04 | 221 | 0.03 |
| Lot | 448 | 0.29 | 1,202 | 0.75 | 2,393 | 1.41 | 2,674 | 1.53 | 2,344 | 1.35 |
| Lot-et-Garonne | 760 | 0.25 | 1,325 | 0.43 | 2,915 | 0.90 | 3,545 | 1.07 | 3,366 | 1.01 |
| Lozère | 36 | 0.05 | 52 | 0.07 | 65 | 0.08 | 79 | 0.10 | 53 | 0.07 |
| Maine-et-Loire | 312 | 0.04 | 759 | 0.10 | 1,218 | 0.16 | 1,384 | 0.18 | 1,242 | 0.15 |
| Manche | 276 | 0.06 | 1,107 | 0.23 | 3,051 | 0.62 | 3,679 | 0.74 | 3,285 | 0.66 |
| Marne | 244 | 0.04 | 274 | 0.05 | 216 | 0.04 | 187 | 0.03 | 195 | 0.03 |
| Haute-Marne | 32 | 0.02 | 57 | 0.03 | 28 | 0.01 | 76 | 0.04 | 71 | 0.04 |
| Mayenne | 116 | 0.04 | 610 | 0.21 | 1,791 | 0.60 | 2,232 | 0.73 | 2,106 | 0.68 |
| Meurthe-et-Moselle | 248 | 0.03 | 302 | 0.04 | 215 | 0.03 | 218 | 0.03 | 180 | 0.02 |
| Meuse | 36 | 0.02 | 50 | 0.03 | 48 | 0.03 | 84 | 0.04 | 51 | 0.03 |
| Morbihan | 444 | 0.07 | 1,265 | 0.20 | 3,677 | 0.53 | 4,197 | 0.58 | 3,681 | 0.49 |
| Moselle | 164 | 0.02 | 301 | 0.03 | 318 | 0.03 | 346 | 0.03 | 297 | 0.03 |
| Nièvre | 112 | 0.05 | 125 | 0.06 | 238 | 0.11 | 335 | 0.15 | 290 | 0.14 |
| Nord | 956 | 0.04 | 1,332 | 0.05 | 943 | 0.04 | 1,094 | 0.04 | 988 | 0.04 |
| Oise | 797 | 0.11 | 973 | 0.13 | 788 | 0.10 | 733 | 0.09 | 707 | 0.09 |
| Orne | 168 | 0.06 | 439 | 0.15 | 1,470 | 0.50 | 1,630 | 0.56 | 1,517 | 0.53 |
| Pas-de-Calais | 928 | 0.06 | 1,247 | 0.09 | 1,422 | 0.10 | 1,485 | 0.10 | 1,209 | 0.08 |
| Puy-de-Dôme | 380 | 0.06 | 571 | 0.09 | 741 | 0.12 | 894 | 0.14 | 771 | 0.12 |
| Pyrénées-Atlantiques | 484 | 0.08 | 876 | 0.15 | 1,170 | 0.18 | 1,655 | 0.25 | 1,671 | 0.25 |
| Hautes-Pyrénées | 112 | 0.05 | 283 | 0.13 | 825 | 0.36 | 1,139 | 0.50 | 1,196 | 0.52 |
| Pyrénées-Orientales | 580 | 0.16 | 962 | 0.24 | 1,721 | 0.40 | 1,959 | 0.43 | 1,832 | 0.39 |
| Bas-Rhin | 892 | 0.09 | 1,434 | 0.14 | 1,158 | 0.11 | 1,183 | 0.11 | 1,079 | 0.10 |
| Haut-Rhin | 404 | 0.06 | 662 | 0.09 | 912 | 0.12 | 1,143 | 0.15 | 1,049 | 0.14 |
| Rhône | 1,364 | 0.09 | 1,818 | 0.12 | 1,642 | 0.10 | 1,808 | 0.10 | 1,946 | 0.11 |
| Haute-Saône | 32 | 0.01 | 66 | 0.03 | 78 | 0.03 | 96 | 0.04 | 90 | 0.04 |
| Saône-et-Loire | 184 | 0.03 | 413 | 0.08 | 683 | 0.12 | 877 | 0.16 | 830 | 0.15 |
| Sarthe | 212 | 0.04 | 340 | 0.06 | 549 | 0.10 | 683 | 0.12 | 520 | 0.09 |
| Savoie | 244 | 0.07 | 672 | 0.18 | 932 | 0.23 | 1,340 | 0.32 | 1,513 | 0.35 |
| Haute-Savoie | 1,012 | 0.18 | 1,543 | 0.24 | 2,892 | 0.42 | 3,956 | 0.53 | 4,234 | 0.53 |
| Paris | 8,894 | 0.41 | 9,219 | 0.43 | 8,468 | 0.39 | 9,118 | 0.41 | 7,499 | 0.34 |
| Seine-Maritime | 852 | 0.07 | 1,078 | 0.09 | 893 | 0.07 | 910 | 0.07 | 748 | 0.06 |
| Seine-et-Marne | 1,458 | 0.14 | 1,964 | 0.16 | 1,527 | 0.12 | 1,547 | 0.12 | 1,448 | 0.10 |
| Yvelines | 4,628 | 0.35 | 5,258 | 0.39 | 4,693 | 0.34 | 4,205 | 0.30 | 3,534 | 0.25 |
| Deux-Sèvres | 120 | 0.03 | 612 | 0.18 | 2,595 | 0.72 | 3,478 | 0.94 | 3,282 | 0.88 |
| Somme | 184 | 0.03 | 336 | 0.06 | 319 | 0.06 | 331 | 0.06 | 303 | 0.05 |
| Tarn | 296 | 0.09 | 763 | 0.22 | 1,566 | 0.43 | 1,693 | 0.45 | 1,565 | 0.41 |
| Tarn-et-Garonne | 388 | 0.19 | 924 | 0.45 | 1,684 | 0.74 | 1,818 | 0.74 | 1,611 | 0.63 |
| Var | 1,688 | 0.21 | 2,002 | 0.22 | 2,335 | 0.24 | 2,554 | 0.25 | 2,671 | 0.25 |
| Vaucluse | 624 | 0.13 | 779 | 0.16 | 903 | 0.17 | 1,026 | 0.19 | 918 | 0.16 |
| Vendée | 236 | 0.05 | 656 | 0.12 | 1,803 | 0.30 | 2,102 | 0.33 | 2,016 | 0.30 |
| Vienne | 212 | 0.06 | 702 | 0.18 | 2,251 | 0.54 | 3,047 | 0.71 | 3,150 | 0.72 |
| Haute-Vienne | 268 | 0.08 | 626 | 0.18 | 3,288 | 0.90 | 4,516 | 1.20 | 4,608 | 1.23 |
| Vosges | 60 | 0.02 | 103 | 0.03 | 114 | 0.03 | 143 | 0.04 | 127 | 0.03 |
| Yonne | 172 | 0.05 | 315 | 0.09 | 371 | 0.11 | 386 | 0.11 | 374 | 0.11 |
| Territoire de Belfort | 68 | 0.05 | 86 | 0.06 | 74 | 0.05 | 44 | 0.03 | 73 | 0.05 |
| Essonne | 1,056 | 0.1 | 1,474 | 0.13 | 1,042 | 0.09 | 834 | 0.07 | 844 | 0.07 |
| Hauts-de-Seine | 3,180 | 0.23 | 3,377 | 0.24 | 2,455 | 0.16 | 2,412 | 0.15 | 2,432 | 0.15 |
| Seine-Saint-Denis | 1,160 | 0.08 | 1,192 | 0.09 | 791 | 0.05 | 864 | 0.06 | 985 | 0.06 |
| Val-de-Marne | 1,456 | 0.12 | 1,585 | 0.13 | 1,133 | 0.09 | 1,022 | 0.08 | 1,124 | 0.08 |
| Val-d'Oise | 945 | 0.09 | 1,247 | 0.11 | 667 | 0.06 | 784 | 0.07 | 732 | 0.06 |
| Guadeloupe | 165 | 0.05 | 173 | 0.04 | 88 | 0.02 | 84 | 0.02 | 103 | 0.03 |
| Martinique | 298 | 0.08 | 279 | 0.07 | 288 | 0.07 | 152 | 0.04 | 96 | 0.03 |
| Guyane | 592 | 0.52 | 239 | 0.15 | 103 | 0.05 | 115 | 0.05 | 87 | 0.03 |
| La Réunion | 163 | 0.03 | 215 | 0.03 | 148 | 0.02 | 150 | 0.02 | 163 | 0.02 |
- Coverage: France excluding Mayotte.
- Source: INSEE, 1990-2016 population censuses, main processing.
graphiqueFigure 4 - Changes in the Share of Britons in the Population
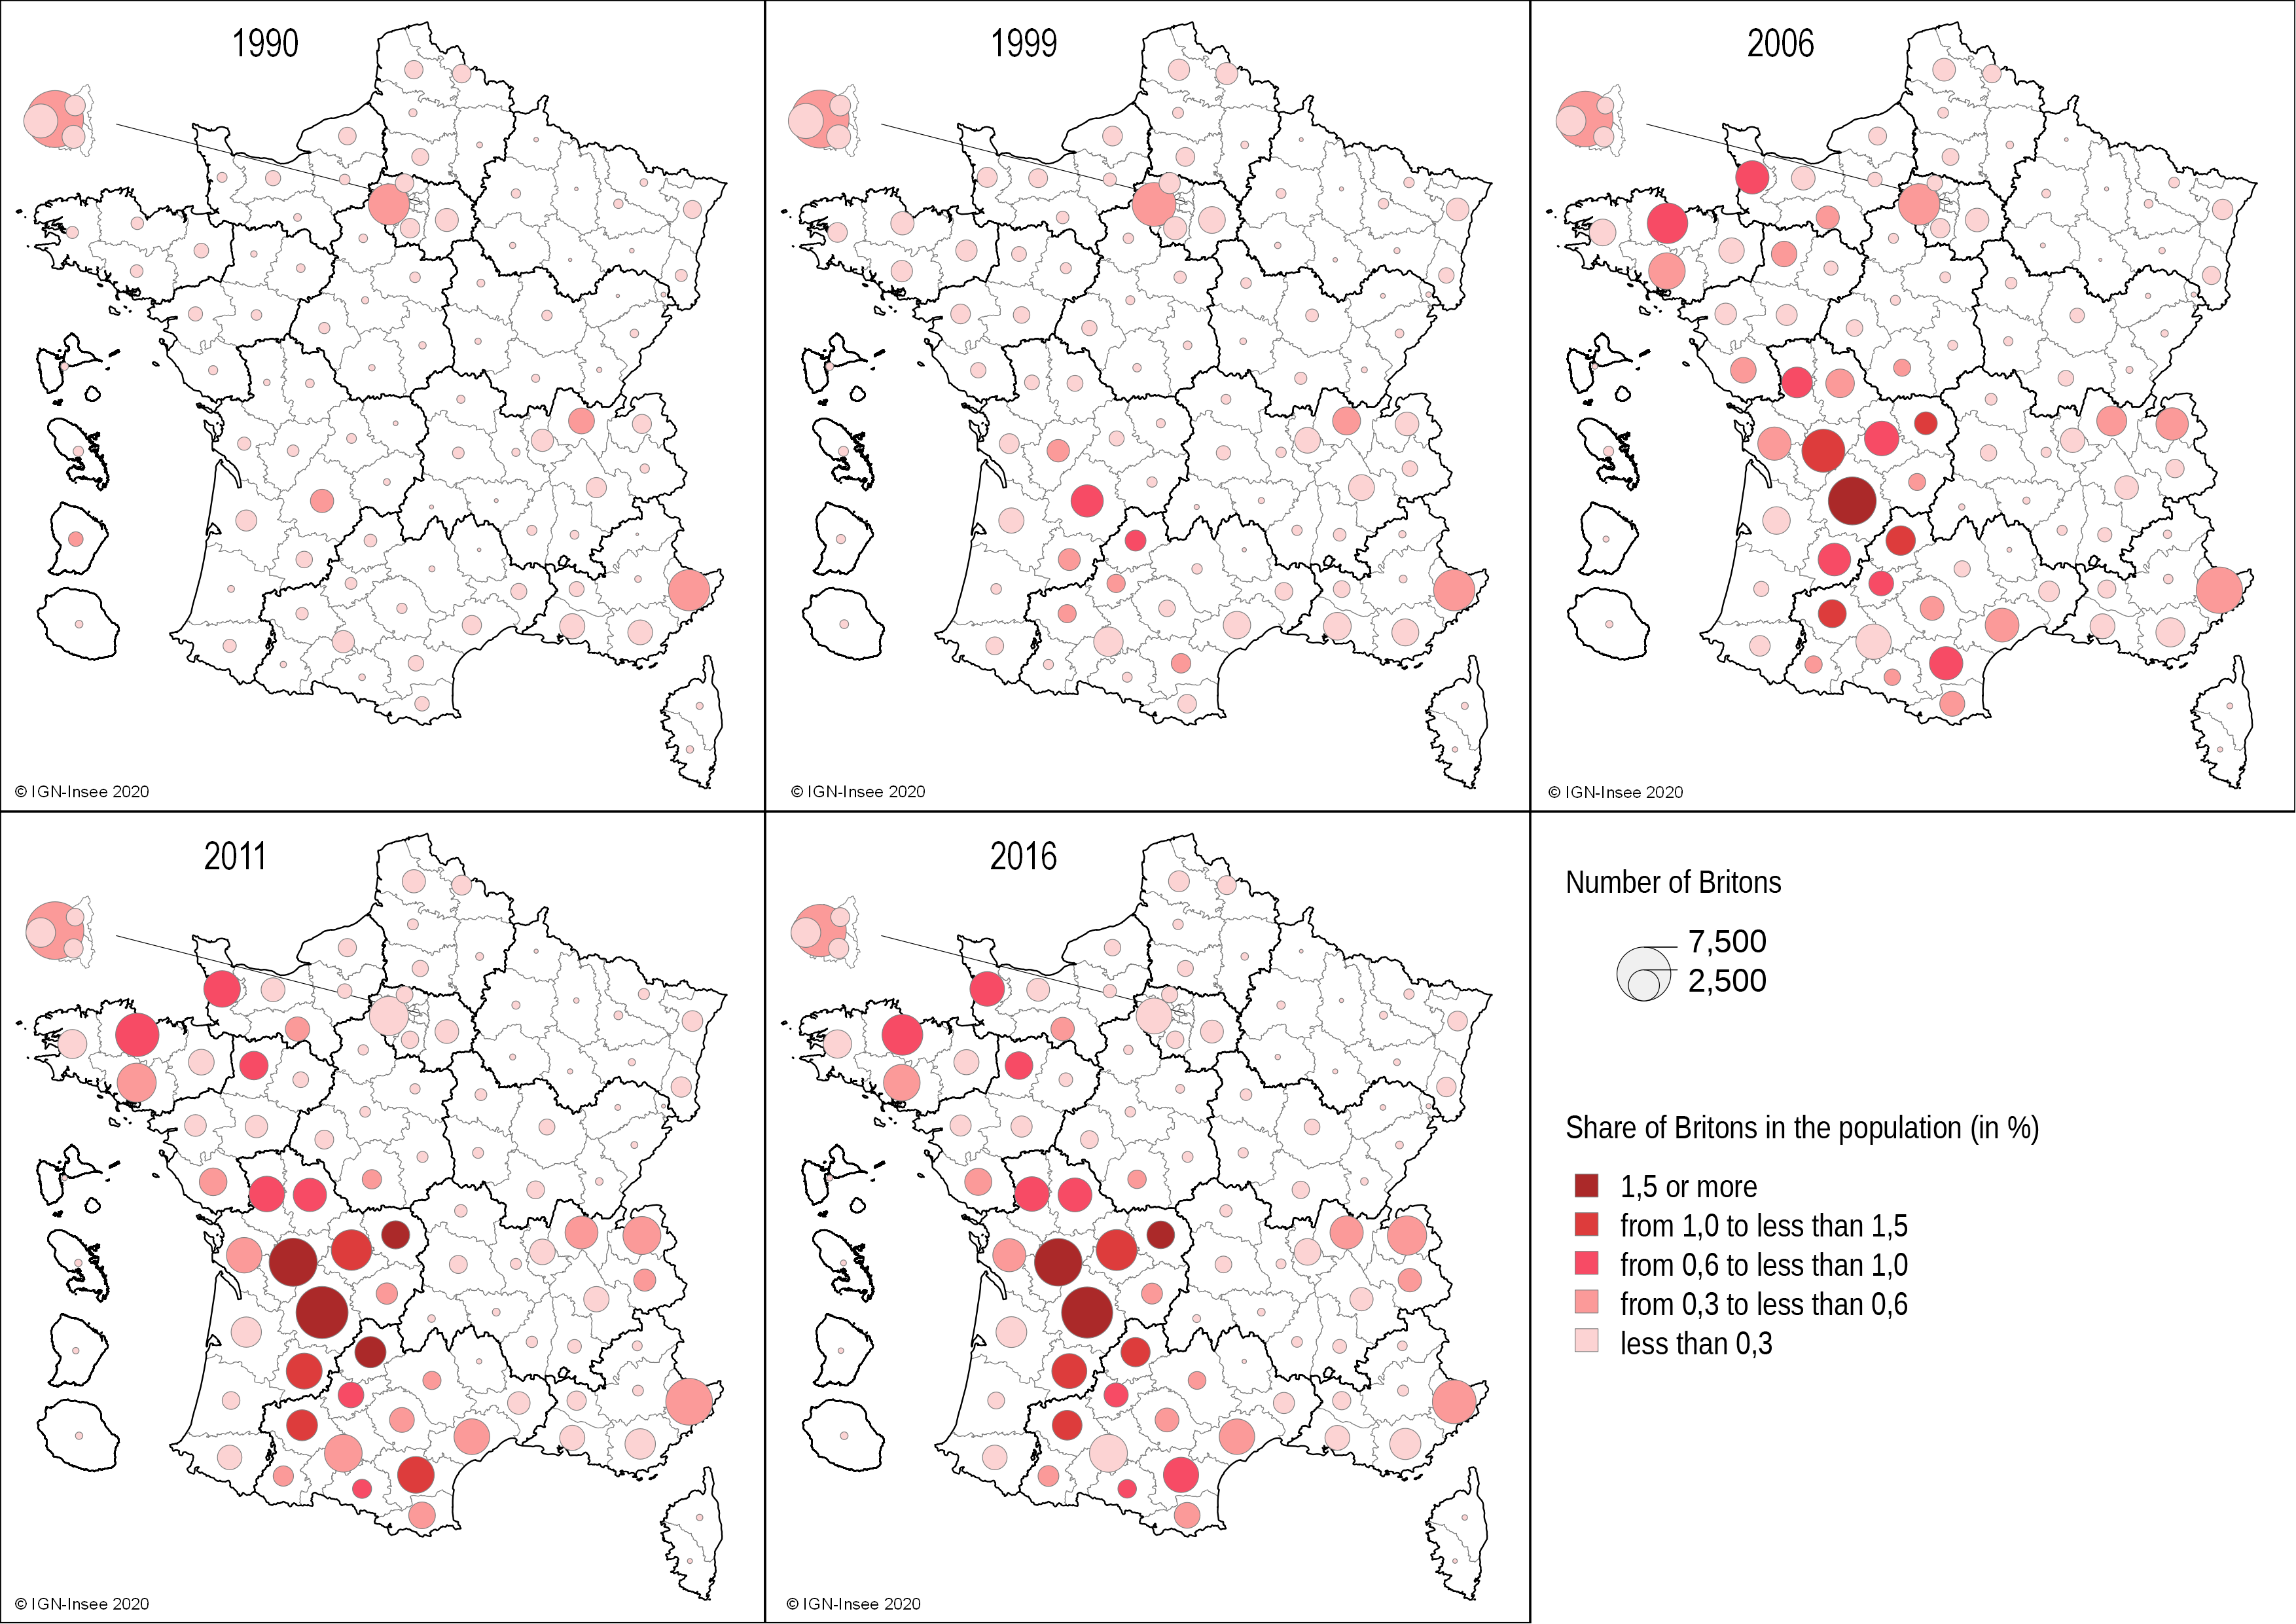
- Coverage: France excluding Mayotte.
- Source: INSEE, 1990-2016 population censuses, main processing.
Britons in Employment Primarily Present in Large Cities
In 2016, 55,000 Britons living in France were in employment, making their number a little higher than that of retirees. A large proportion of these reside in living areas centred on large agglomerations (group C) that offer jobs in management, executive positions and intellectual professions (Figure 5). In these living areas, Britons who work make up the majority (61%) (Figure 6). These residents are generally qualified (a quarter are managers), graduates (two thirds are graduates of higher education) and relatively young (one in two are between 18 and 50 years old). In addition, 20% live alone and 59% as a couple, with the same numbers living with children as without. These couples are more often bi-national: 6 in 10 Britons have a French partner. In the west, some living areas are home to a higher proportion of Britons pursuing their studies. For example, in the living areas of Tarbes, Poitiers, Limoges, Angers, Caen and Rennes, students represent a quarter of British nationals.
Historically, Britons settled in the largest cities for work. In this way, for the agglomerations in question, the British nationals who live there have been there for a longer time: 36% arrived over 20 years ago, compared with 22% on average. The Britons who have acquired French nationality are also largely overrepresented in these areas. In 1990, 6 in 10 Britons who had settled in France held French nationality in these large cities. By 2016, this number had grown only slightly (38,300) and represents no more than a quarter of Britons living in France.
Britons in Employment also Living in Border or Alpine Tourist Regions
In 2016, 5,700 Britons were living in a dozen living areas close to Switzerland (nine of which around Geneva and two in Haut-Rhin, close to Basel) or Italy (Menton) (Figure 5). Of these, 61% had a job, 75% of which were located outside France (group D). With its international organisations and tertiary activities, Geneva attracts an international, qualified workforce. As a result, 500 Britons residing in those living areas work for this type of organisation. Among the British residents aged 14 and above, 63% are higher education graduates; almost 20% are managers and as many are mid-level professionals.
Another group of 11 Alpine tourist living areas are also home to populations of young people from the United Kingdom who have come to work (group E). In these areas, which bring together a total of 3,400 foreign nationals, 77% of the Britons over the age of 14 have a job. They primarily carry out activities associated with tourism, such as accommodation and catering (27%) or transport and storage (9%). There are also more craftsmen, retailers and company directors here (18%) than elsewhere. The Britons represent on average 2% of the population in these living areas, with this share reaching 5% in Chamonix-Mont-Blanc and 9% in Morzine. Their arrival is a little more recent than in the other living areas, with 52% having lived there for less than 10 years. They are also younger, with three quarters under the age of 50, compared with 41% of the Britons living in France as a whole. In these living areas, 4.4% of children of primary-school age (920 children) are British. These areas are also a tourist destination for UK residents.
tableauFigure 5 - Different Types of Living area According to Profile and the Presence of the British Population
| Detailed data is available in the download file. |
graphiqueFigure 5 - Different Types of Living Area According to Profile and the Presence of the British Population

- Note: groups from one typology created using living areas comprising at least 100 British people.
- Source: INSEE, 2016 population census.
tableauFigure 6 - Breakdown of Britons According to Their Activity in 2016, by Type of Living Area
| Employed | Unemployed | Retired | Pupils, students, interns | Other inactive people | |
|---|---|---|---|---|---|
| Group A | 26 | 4 | 56 | 4 | 10 |
| Group B | 28 | 4 | 56 | 4 | 9 |
| Group C | 61 | 6 | 15 | 9 | 8 |
| Group D | 61 | 4 | 18 | 7 | 10 |
| Group E | 77 | 2 | 9 | 4 | 8 |
| All groups | 41 | 5 | 39 | 5 | 9 |
- Note: groups from one typology created using living areas comprising at least 100 British people (Figure 5).
- Coverage: France excluding Mayotte, population aged 14 or over.
- Source: INSEE, 2016 population census.
graphiqueFigure 6 - Breakdown of Britons According to Their Activity in 2016, by Type of Living Area
- Note: groups from one typology created using living areas comprising at least 100 British people (Figure 5).
- Coverage: France excluding Mayotte, population aged 14 or over.
- Source: INSEE, 2016 population census.
Box 1 - In the Future, Will There Be More Britons Applying for French Nationality?
Brexit will have a direct impact on the life of numerous British expats. It could prompt some of them to apply for French nationality. In 2016, 22,800 people living in France, but born with British nationality, held French nationality. As of 1 January 2021 (or 1 July 2021 for British nationals already settled in France), the provisions of common law will apply and it will be necessary to hold a residence permit to settle in France.
Box 2 - France: Also a Tourist Destination for UK Residents
In addition to the 148,300 British residents, a large number of UK inhabitants also come to stay in France for short periods, whether in their own second home or in tourist accommodation. Britons own 86,000 second homes in France, making them the largest group of non-French homeowners. In particular, they own twice as many homes as inhabitants from Belgium, Italy or Switzerland. They prefer to purchase second homes in the same living areas as those where British retirees have settled (group A). In these regions, their properties represent 17% of all second homes. The also own a significant number (8,600 homes) in the Alpine tourist areas, where this share is at 6%.
In 2018, UK inhabitants were the biggest foreign users of collective tourist accommodation in Metropolitan France, which comprises hotels, campsites and other tourist accommodation. In total, they spent over 19 million overnight stays in these establishments, accounting for 14% of overnight stays by non-French tourists. This is closely followed by tourists from Germany and the Netherlands (13% each) and then Belgium (10%). However, visits by UK residents dropped between 2015 and 2018 (a 7.5% drop in overnight stays), while those of foreign tourists rose (+ 6.7%). This drop in visits by British tourists affected all tourist areas, and the Alpine area in particular (– 29%). The reduction is less pronounced in urban areas (– 4%), which receives more visits from business customers, and other more rural areas. The economic context associated with Brexit has had an impact on this development. At this time, the conditions for British nationals travelling to France have not been changed by Brexit, but they may change after 31 December 2020, which could have an impact on the French tourist accommodation sector. Furthermore, in 2020, tourist visits, especially from British visitors, have been heavily affected by the health crisis associated with the Covid-19 epidemic.
Sources
The 2016 population census is the main source used, together with the 1990, 1999, 2006 and 2011 editions. It is used to find out the current and birth nationalities reported by respondents. However, it cannot be used to count the number of people with dual nationality.
The data on second homeowners are taken from the 2017 edition of the Housing and individual demographic file (Fideli). The data on tourist numbers are taken from the 2015 to 2018 editions of the visitor survey of collective tourist accommodation (excluding overseas departments).
The typology of the living areas is drawn up on the basis of a principal component analysis followed by an ascending hierarchical classification. It only relates to the living areas with at least 100 British nationals and uses the 2016 population census. It is based on variables that assess the presence of Britons in the living areas, their age, their level of educational qualification, how they live (in ordinary housing or communities, owners or renters, as a family, as a couple with a British partner or not, or alone), their type of activity (retired, employed, student, etc.), their socioprofessional category, their cross-border commuter status and the time since they settled in France.
Définitions
In this study, a Brit or a British national refers to a person who reports that they are of British nationality and reside in France when filling in the population census. The people reporting that they are of French nationality but previously held British nationality (i.e. they have acquired French nationality after birth) are not included in the scope of this study.
A resident in the area is counted as such, in the population census, if they reside in France for at least 12 consecutive months.
A living area is the smallest area within which inhabitants have access to the most common facilities and services.
The population density grid classifies the communes on the basis of the spread of the population across their territory. It delineates four density levels: densely populated, intermediate-density, sparsely populated and very sparsely populated communes. The higher and more concentrated the population, the more dense the commune.
Secondary homes are defined here on the basis of a fiscal criterion. They refer to furnished premises used for residential purposes but not permanently occupied, and subject to housing tax. This definition excludes tourist residences and differs from that used in the population census. The origin of owners is determined on the basis of the country of residence of these people, irrespective of their nationality.
The number of overnight stays corresponds to the total number of nights spent in a tourist establishment by the customers. A couple staying for three nights in such an establishment counts as six overnight stays.
Pour en savoir plus
Pauvers S., “ L’Occitanie, deuxième région d’accueil des Britanniques expatriés ” [Occitanie, the second most popular region for British expats], Insee Analyses Occitanie No. 83, October 2019.
Tee Anderson P., “Ouvrir dans un nouvel onglet Du rêve à l’« exil » : les Britanniques en France et en Espagne des années 1960 à nos jours ” [From dream to ‘exile’: Britons in France and Spain from the 1960s to today], Presses universitaires de Perpignan, 2010.
Ardillier-Carras F., “Ouvrir dans un nouvel onglet L’immigration britannique en France : le cas du Limousin ” [British immigration to France: the case of Limousin], in Population & Avenir 2008/5 No. 690, 2008.
