

 30 October 2018
2018- n° 288French GDP rose by 0.4% in Q3 2018 Quarterly national accounts - first estimate - third quarter 2018
30 October 2018
2018- n° 288French GDP rose by 0.4% in Q3 2018 Quarterly national accounts - first estimate - third quarter 2018
In Q3 2018, GDP in volume terms* accelerated slightly: +0.4% after +0.2%. Household consumption expenditures recovered (+0.5% after −0.1%). Total gross fixed capital formation grew almost as quickly as in the previous quarter (GFCF: +0.8% after +0.9%). Overall, final domestic demand excluding inventory changes accelerated: it contributed 0.5 points to GDP growth, after 0.2 points in the previous quarter.
Imports slowed down in Q3 (+0.3% after +0.7%), whereas exports accelerated (+0.7% after +0.1%). All in all, foreign trade balance contributed positively to GDP growth, +0.1 points, after −0.2 points in Q2. Conversely, changes in inventories contributed negatively to GDP growth (−0.2 points after +0.2 points).
graphiqueGraph – GDP and its main components
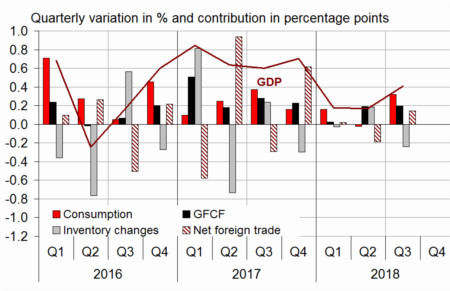
- Source: INSEE

* This growth rate is seasonally and working-day adjusted; volumes are chain-linked previous-year-prices volumes.
tableauTab1 – GDP and its main components: chain-linked volumes
| 2017 Q4 | 2018 Q1 | 2018 Q2 | 2018 Q3 | 2017 | 2018 (ovhg) | |
|---|---|---|---|---|---|---|
| GDP | 0.7 | 0.2 | 0.2 | 0.4 | 2.3 | 1.5 |
| Imports | 0.3 | -0.4 | 0.7 | 0.3 | 4.1 | 1.3 |
| Household consumption *expenditure | 0.2 | 0.2 | -0.1 | 0.5 | 1.1 | 0.9 |
| General government's *consumption expenditure | 0.2 | 0.1 | 0.2 | 0.2 | 1.4 | 0.9 |
| GFCF | 1.0 | 0.1 | 0.9 | 0.8 | 4.7 | 2.8 |
| *of which Non-financial corporated and unincorporated enterprises | 1.3 | 0.1 | 1.3 | 1.4 | 4.4 | 3.7 |
| Households | 0.8 | 0.2 | 0.0 | -0.2 | 5.6 | 1.6 |
| General government | 0.2 | 0.1 | 0.6 | 0.2 | 1.6 | 1.1 |
| Exports | 2.3 | -0.4 | 0.1 | 0.7 | 4.7 | 2.9 |
| Contributions: | ||||||
| Internal demand excluding inventory changes | 0.4 | 0.2 | 0.2 | 0.5 | 2.0 | 1.3 |
| Inventory changes | -0.3 | 0.0 | 0.2 | -0.2 | 0.2 | -0.3 |
| Net foreign trade | 0.6 | 0.0 | -0.2 | 0.1 | 0.1 | 0.5 |
- Source: INSEE
Total production accelerated
Production in goods and services accelerated in Q3 2018 (+0.7% after +0.3%). It bounced back in goods (+0.8% after −0.2%), and it grew at a slightly faster pace than in the previous quarter in services (+0.6% after +0.4%).
Output in manufactured recovered (+0.8% after −0.1%). Production in refineries bounced back (+11.3% after −9.7%) ; it had been notably low in Q2 due to maintenance work. Conversely, construction was at a standstill (+0.0% after +0.6%).
tableauTab2 – Production, consumption and GFCF: main components
| 2017 Q4 | 2018 Q1 | 2018 Q2 | 2018 Q3 | 2017 | 2018 (ovhg) | |
|---|---|---|---|---|---|---|
| Production of branches | 1.0 | 0.1 | 0.3 | 0.7 | 2.6 | 1.9 |
| Goods | 1.2 | -0.6 | -0.2 | 0.8 | 2.2 | 1.0 |
| Manufactured Industry | 1.5 | -1.0 | -0.1 | 0.8 | 2.4 | 1.0 |
| Construction | 0.5 | -0.3 | 0.6 | 0.0 | 3.5 | 1.0 |
| Market services | 1.1 | 0.5 | 0.5 | 0.8 | 3.2 | 2.7 |
| Non-market services | 0.3 | 0.2 | 0.3 | 0.2 | 1.1 | 1.0 |
| Household consumption | 0.2 | 0.2 | -0.1 | 0.5 | 1.1 | 0.9 |
| Food products | 0.2 | -0.3 | -1.3 | 0.1 | 0.3 | -1.2 |
| Energy | -1.4 | 0.9 | -2.2 | 0.4 | 0.1 | -0.4 |
| Engineered goods | 0.0 | -0.3 | 1.0 | 1.1 | 2.6 | 1.7 |
| Services | 0.5 | 0.5 | 0.1 | 0.3 | 1.6 | 1.4 |
| GFCF | 1.0 | 0.1 | 0.9 | 0.8 | 4.7 | 2.8 |
| Manufactured goods | 1.7 | -1.2 | 1.3 | 1.6 | 3.7 | 2.9 |
| Construction | 0.2 | 0.1 | 0.6 | -0.2 | 3.5 | 1.2 |
| Market services | 1.5 | 1.0 | 0.8 | 1.7 | 7.0 | 4.6 |
- Source: INSEE
Household consumption recovered
Household consumption expenditure recovered in Q3 2018 (+0.5% after +0.1%): consumption of goods bounced back significantly (+0.6% after −0.4%) and that of services accelerated slightly (+0.3% after +0.1%).
In particular, expenditures on energy recovered slightly (+0.4% after −2.2%), after temperatures higher than seasonal norms in Q2. Consumption of food products stablised after two quarters of decline (+0.1% after −1.3% in Q2).
In services, transport expenses bounced back markedly (+3.7% after −2.9%) after a significant decline in Q2, following strikes in rail transport.
* This growth rate is seasonally and working-day adjusted; volumes are chain-linked previous-year-prices volumes.
tableauTab3 – Sectoral accounts
| 2017 Q4 | 2018 Q1 | 2018 Q2 | 2018 Q3 | 2017 | 2018 (ovhg) | |
|---|---|---|---|---|---|---|
| Profit ratio of NFCs* (level) | 32.0 | 32.0 | 31.5 | 32.0 | ||
| Households' purchasing power | 0.2 | -0.5 | 0.6 | 1.4 | 0.5 |
- *NFCs: non-financial corporations
- Source: INSEE
tableauTab4 – Households' disposable income and ratios of households' account
| 2017 Q4 | 2018 Q1 | 2018 Q2 | 2018 Q3 | 2017 | 2018 (ovhg) | |
|---|---|---|---|---|---|---|
| HDI | 0.7 | 0.1 | 1.1 | 2.7 | 1.9 | |
| Household purchasing power | 0.2 | -0.5 | 0.6 | 1.4 | 0.5 | |
| HDI by cu* (purchasing power) | 0.1 | -0.6 | 0.5 | 0.9 | 0.2 | |
| Adjusted HDI (purchasing power) | 0.3 | -0.3 | 0.6 | 1.5 | 0.7 | |
| Saving rate (level) | 14.3 | 13.6 | 14.3 | 14.2 | ||
| Financial saving rate (level) | 4.4 | 3.6 | 4.2 | 4.4 |
- *cu: consumption unit
- Source: INSEE
Corporate investment remained dynamic, household investment faltered slightly
In Q3 2018, total GFCF grew at almost the same pace as in the previous quarter (+0.8% after +0.9%). It was sustained by corporate investment (+1.4% after +1.3%), notably investment in IT activities and information services, as well as in automotive. Conversely, household investment faltered sligthly (−0.2% after +0.0%), in connection with the decline in housing starts since late 2017.
tableauTab5 – Ratios of non-financial corporations' account
| 2017 Q4 | 2018 Q1 | 2018 Q2 | 2018 Q3 | 2017 | |
|---|---|---|---|---|---|
| Profit share | 32.0 | 32.0 | 31.5 | 32.0 | |
| Investment ratio | 23.6 | 23.6 | 23.9 | 23.5 | |
| Savings ratio | 22.4 | 23.0 | 22.7 | 22.7 | |
| Self-financing ratio | 95.1 | 97.5 | 94.9 | 96.6 |
- Source: INSEE
Foreign trade balance contributed positively to GDP this quarter
In Q3, imports accelerated (+0.7% after +0.1%), while exports slowed down (+0.3% after +0.7%). All in all, foreign trade balance contributed positively to GDP growth: +0.1 points, after −0.2 points in Q2 2018.
tableauTab6 – Expenditure, receipts and net borrowing of public administrations
| 2017 Q4 | 2018 Q1 | 2018 Q2 | 2018 Q3 | 2017 | |
|---|---|---|---|---|---|
| In billions of euros | |||||
| Total expenditure | 327.1 | 329.2 | 328.5 | 1294.3 | |
| Total receipts | 314.6 | 314.8 | 313.7 | 1232.7 | |
| Net lending (+) or borrowing (–) | -12.5 | -14.5 | -14.9 | -61.6 | |
| In % of GDP | |||||
| Net lending (+) or borrowing (–) | -2.2 | -2.5 | -2.5 | -2.7 |
- Source: INSEE
Stock variations weighed down GDP growth
In Q3 2018, stock variations contributed negatively to GDP growth: −0.2 points (after +0.2 points). In particular, they decreased significantly in transport equipment.
Revisions
The GDP growth estimate for Q2 2018 is confirmed at +0.2%. Slight revisions in different aggregates offset each other; they are mainly due to the revision of indicators and to the update of seasonal adjustment coefficients.