

 24 May 2018
2018- n° 132In May 2018, the business climate weakens sharply in services Monthly survey of services - May 2018
24 May 2018
2018- n° 132In May 2018, the business climate weakens sharply in services Monthly survey of services - May 2018
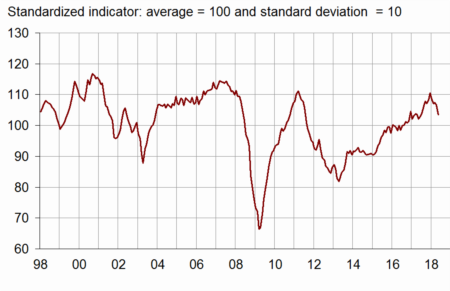
According to business managers surveyed in May 2018, the business climate in services has weakened sharply. The business climate composite indicator has lost four points, returning to its level of June 2017 (103). However, it stands above its long-term average (100).
- Almost all the balances of opinion have declined
- In road transport, the business climate is stable
- In accommodation and food services, the business climate has deteriorated markedly
- The business climate has weakened again in information and communication
- The business climate has recovered a little in real estate activities
- In professional activities, the business climate has worsened clearly
- The business climate has weakened in administrative and support service activities
According to business managers surveyed in May 2018, the business climate in services has weakened sharply. The business climate composite indicator has lost four points, returning to its level of June 2017 (103). However, it stands above its long-term average (100).
graphiqueGraph 1 – Business climate composite indicator
For the first time since August 2016, the turning point indicator stands in the area indicating an unfavourable short-term economic situation.
graphiqueGraph 2 – Turning point indicator

- Note: close to 1 (respectively –1), this indicator indicates a favourable short-term economic situation (respectively unfavourable). The uncertainty area is between –0.3 and +0.3.
Almost all the balances of opinion have declined
The balance of opinion on expected activity has fallen just below its long-term average. That on past activity has sharply declined too and has returned to its average, that is its lowest level since June 2017. The balance on general outlook, which relates the assessment of business leaders over their whole sector, has also deteriorated but still stands well above its average. That on expected demand has slightly weakened while remaining above its average.
The balances on employment have declined again. While that on expected employment is clearly above its average, that on past employment has moved below it.
However, the business leaders remain upbeat about investment. The balance on planned investments holds steady whereas that on past investments has grown sharply. Both are above their average.
tableauTable 1 – Economic outlook in the services sector
| Average* | Feb. 18 | March 18 | April 18 | May 18 | |
|---|---|---|---|---|---|
| Composite indicator | 100 | 107 | 107 | 107 | 103 |
| General outlook | –7 | 4 | 3 | 3 | 0 |
| Past activity | 2 | 9 | 6 | 8 | 2 |
| Expected activity | 2 | 3 | 4 | 5 | 1 |
| Expected demand | 0 | 6 | 8 | 4 | 3 |
| Past selling prices | –4 | –2 | –2 | 0 | 0 |
| Expected selling prices | –3 | –4 | –3 | –3 | –2 |
| Past employment | 3 | 13 | 8 | 3 | 1 |
| except temporary work agencies | 1 | 5 | 3 | 1 | 0 |
| Expected employment | 3 | 10 | 15 | 12 | 11 |
| except temporary work agencies | 0 | 5 | 6 | 5 | 4 |
| Investments | |||||
| Past investments | 2 | 7 | 4 | 7 | 11 |
| Expected investments | 1 | 6 | 5 | 4 | 4 |
- * Average since 1989 for the composite indicator and since 1988 for the balances of opinion
- Source: INSEE, monthly business survey in services.
The business climate composite indicator is above its average in all sub-sectors except in real estate activities. It has decreased in accommodation and food service activities, information-communication, professional, scientific and technical activities, and in administrative and support service activities. The climate is stable in road transport and it has improved a little in real estate activities.
In road transport, the business climate is stable
In road transport, the business climate indicator is stable after a sharp decline last month. At 110, it is well above its average level. The fall in the balance of opinion on past activity is offset by the rebound in the balances on employment. All balances are markedly above their average.
In accommodation and food services, the business climate has deteriorated markedly
The climate in accommodation and food services has lost six points. Nevertheless, at 106, it remains clearly above its long-term average. This downturn is driven by the marked decrease in the balances on activity, on expected demand and on general outlook, probably due in part to the strikes in transports.
The business climate has weakened again in information and communication
In information and communication, the business climate has lost one point (101) and stands slightly above its average level. The balances on activity, on expected demand and past employment have decreased. The balances on employment and general outlook remain above their long-term average.
The business climate has recovered a little in real estate activities
In real estate activities, the climate has gained two points (87) but stands well below its long-term average. In particular, the balances on past activity and on past employment have improved. However, all the balances of opinion except that on employment stand below their average.
In professional activities, the business climate has worsened clearly
The business climate in professional, scientific and technical activities has lost four points (105) but still stands above its long-term average. All the balances of opinion have declined, except that on past activity. However, they all remain above to their average.
The business climate has weakened in administrative and support service activities
In administrative and support service activities, the climate has lost three points. At 108, it stands well above its long-term average. All the balances have fallen, in particular those on activity. The balance on past activity has returned to its average, that on past employment remain below it. The other balances are above their average.
tableauTable 2 – Business climate composite indicator andbalances of opinion by sub-sector in services
| Aggregated classification (NA 2008) at level A21 | Mean* | Feb. 18 | March 18 | April 18 | May 18 |
|---|---|---|---|---|---|
| Road transport (8%) | |||||
| Composite indicator | 100 | 115 | 114 | 110 | 110 |
| Past activity | –6 | 15 | 16 | 14 | 6 |
| Expected activity | –7 | 12 | 11 | 6 | 5 |
| Expected demand | –10 | 23 | 13 | 8 | 8 |
| Past employment | –5 | 13 | 18 | –1 | 4 |
| Expected employment | –8 | 5 | 8 | 2 | 4 |
| General outlook | –20 | 13 | 12 | 6 | 5 |
| Accommodation and food service activities (11%) | |||||
| Composite indicator | 100 | 116 | 109 | 112 | 106 |
| Past activity | –7 | 2 | –9 | 9 | –6 |
| Expected activity | –7 | 7 | 2 | 3 | –2 |
| Expected demand | –9 | 3 | 4 | 2 | –4 |
| Past employment | –4 | 5 | –7 | –4 | –4 |
| Expected employment | –5 | –2 | –3 | –3 | 1 |
| General outlook | –13 | 9 | –4 | –1 | –6 |
| Information and communication (24%) | |||||
| Composite indicator | 100 | 103 | 102 | 102 | 101 |
| Past activity | 8 | 11 | 3 | 5 | –1 |
| Expected activity | 9 | –3 | 1 | 5 | –1 |
| Expected demand | 10 | –1 | 10 | 4 | 2 |
| Past employment | 6 | 18 | 16 | 18 | 15 |
| Expected employment | 11 | 18 | 13 | 13 | 14 |
| General outlook | 0 | 5 | 3 | 3 | 4 |
| Real estate activities (13%) | |||||
| Composite indicator | 100 | 86 | 89 | 85 | 87 |
| Past activity | 7 | 10 | 2 | –1 | 3 |
| Expected activity | 7 | –8 | –2 | –7 | –8 |
| Expected demand | 2 | 2 | 5 | 0 | 1 |
| Past employment | 3 | 1 | –6 | –3 | 3 |
| Expected employment | 3 | –3 | 3 | 11 | 5 |
| General outlook | –3 | –17 | –15 | –17 | –17 |
| Professional, scientific and technical activities (24%) | |||||
| Composite indicator | 100 | 108 | 110 | 109 | 105 |
| Past activity | –1 | 1 | 6 | 7 | 7 |
| Expected activity | –2 | 5 | 6 | 2 | –1 |
| Expected demand | –5 | 3 | 4 | 3 | 0 |
| Past employment | 1 | 9 | 6 | 10 | 4 |
| Expected employment | 0 | 11 | 10 | 11 | 9 |
| General outlook | –9 | 1 | 3 | 4 | –2 |
| Administrative and support service activities (18%) | |||||
| Composite indicator | 100 | 111 | 112 | 111 | 108 |
| Past activity | 6 | 23 | 24 | 14 | 6 |
| Expected activity | 5 | 15 | 15 | 17 | 11 |
| Expected demand | 3 | 16 | 15 | 13 | 12 |
| Past employment | 10 | 23 | 13 | 0 | –1 |
| Expected employment | 8 | 17 | 33 | 23 | 22 |
| General outlook | –4 | 10 | 11 | 10 | 9 |
- The figures in parentheses indicate the weights used to aggregate the sub-sector balances of opinion.
- *Composite indicator: average since 1989 (2006 for road transport); balances of opinion: average since 1988 (2006 for road transport)
- Source: INSEE, monthly business survey in services.
Documentation
Abbreviated Methodology (2017) (pdf,177 Ko)
Pour en savoir plus
Time series : Economic outlook surveys – Services