

 12 January 2018
2018- n° 6In December 2017, consumer prices rose by 0.3% over a month and by 1.2% year on year Consumer price index - final results - December 2017
12 January 2018
2018- n° 6In December 2017, consumer prices rose by 0.3% over a month and by 1.2% year on year Consumer price index - final results - December 2017
In December 2017, the Consumer Prices Index (CPI) gathered pace at +0.3% after +0.1% in November. This sharper rise came from a seasonal rebound in services prices and, in a lesser extent, from that of manufactured product prices. On the other hand, energy prices and tobacco prices slowed down and those of food were stable.
Monthly change: +0.3% in December; Year-on-year change: +1.2%
In December 2017, the Consumer Prices Index (CPI) gathered pace at +0.3% after +0.1% in November. This sharper rise came from a seasonal rebound in services prices and, in a lesser extent, from that of manufactured product prices. On the other hand, energy prices and tobacco prices slowed down and those of food were stable.
Seasonally adjusted, consumer prices hardly slowed down after a slight acceleration in the previous month: +0.1% after +0.2% in November.
Year on year, consumer prices rose by 1.2% in December, as in November. After four months of consecutive increase, the stability of inflation resulted from a slowdown in energy prices and food prices offset by a lower drop in manufactured product prices and a sharper growth in tobacco prices. Services prices increased by 1.0%, as in the three previous months.
Core inflation was stable again over a year
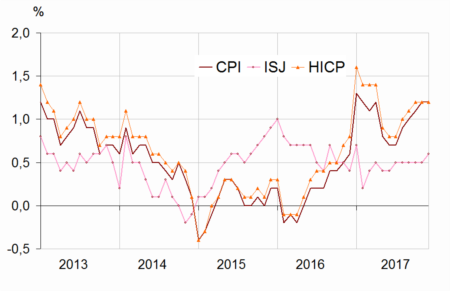
In December 2017, the core inflation index (ISJ) was stable after an increase of 0.1% in November. Over a year, core inflation hardly accelerated at +0.6% after +0.5% in the five previous months. The Harmonised Index of Consumer Prices (HICP) accelerated (+0.4% after +0.1%); year on year, it rose by 1.2% as in the previous month.
Slowdown in energy prices year on year
Energy prices slowed down in December 2017 after an acceleration in the previous month (+5.0% year on year after +5.4%). This lesser dynamism was due to those of the prices of petroleum products (+8.2% after +8.6%) and gas (+2.6% after +4.1% year on year). Electricity prices were up 1.5% year on year, as in the four previous months.
tableauTable1 – Detailed figures for various groups
| Items | Weight | Index | Percentage change | |
|---|---|---|---|---|
| 2017 | Dec. 2017 | m-on-m change(2) | y-on-y change(3) | |
| a) All households | ||||
| Overall | 10000 | 101.85 | 0.3 | 1.2 |
| Overall SA(1) | 10000 | 101.76 | 0.1 | 1.2 |
| Food | 1627 | 102.10 | 0.0 | 1.3 |
| Fresh food | 235 | 107.43 | −0.1 | 2.6 |
| Other food | 1392 | 101.26 | 0.0 | 1.1 |
| Tobacco | 188 | 106.19 | 1.5 | 6.0 |
| Manufactured products | 2617 | 99.75 | 0.1 | −0.1 |
| Clothing and footwear | 433 | 105.18 | 0.8 | −0.1 |
| Medical products | 433 | 94.28 | −0.3 | −1.8 |
| Other manufactured products | 1751 | 99.86 | 0.1 | 0.3 |
| Energy | 748 | 105.33 | 0.5 | 5.0 |
| Petroleum products | 378 | 107.87 | 0.7 | 8.2 |
| Services | 4820 | 102.22 | 0.5 | 1.0 |
| Actual rentals and services for dwellings | 779 | 101.36 | 0.1 | 0.5 |
| Health services | 600 | 102.44 | 0.3 | 2.2 |
| Transport | 282 | 101.99 | 5.2 | 1.1 |
| Communication | 242 | 98.28 | 0.0 | −4.0 |
| Other services | 2917 | 102.74 | 0.2 | 1.4 |
| Total except rents and tobacco | 9183 | 101.84 | 0.3 | 1.2 |
| Total except tobacco | 9812 | 101.76 | 0.3 | 1.1 |
| b) Urban working-class households or households of employees | ||||
| All products excluding tobacco | 9710 | 101.65 | 0.2 | 1.0 |
| c) Households that belong to the lowest equivalized disposable income quintile - France | ||||
| All products excluding tobacco | 9705 | 101.57 | 0.3 | 1.0 |
- (1) seasonally adjusted
- (2) [m/(m-1)] %
- (3) Evolution [m/(m-12)] %
- Geographical coverage: France excluding Mayotte
- Source: INSEE - Consumer Price Indices
Lesser rise in food prices
In December 2017, food prices rose by 1.3% year on year after +1.5% in November. Fresh product prices slowed down for the second consecutive month (+2.6% year on year after +4.5% in October and +3.6% in November): vegetable prices increased less sharply (+3.3% after +4.9%) while the prices of fresh fruits increased further (+6.7% after +6.4%). Excluding fresh products, food prices rose by 1.1% over a year, as in October and in November. The acceleration in oils and fats prices continued (+7.4% over one year after +6.7%).
Lesser drop in prices of manufactured products
Year on year, the decrease in manufactured products prices softened for the fourth consecutive month (−0.1% in December after −0.2%). This slighter drop came, as in the two previous months, from those in the prices of clothing and footwear (−0.1% year on year after −0.3%). In contrast, the prices of medical products declined more in December than in November (−1.8% after −1.6%). The prices of “other manufactured products” rose faster: +0.3% year on year after +0.1% in November. Over a month, their prices recovered by 0.1% after a downturn of 0.1% in November. The prices of games and hobbies were stable after −4.1% in the previous month and the prices in sport equipment dropped less than in November (−0.4% after −0.9%). On the other hand, the prices of furniture and furnishing edged down (−0.1%) after a slight rebound in the previous month.
Further stability in services prices year on year
Year on year, services prices rose by 1.0%, as in the three previous months. The prices of health services continued to rise (+2.2% after +1.9% year on year). Transport prices hardly gathered pace year on year (+1.1% after +1.0%): over the month they bounced back (+5.2% after −2.8%). In addition, the prices of telecommunications services fell less than in the previous month again (−4.0% year on year after −4.5%). On the other hand, the prices in accomodation services significantly slowed down (+2.0% after +4.0% year on year): over the month, prices rose less than in December 2016 (+0.8% against +2.7%), due to the shift of the Christmas holidays.
graphiqueGraph1 – Consumer Price Index (CPI), core inflation (ISJ) (1) and Harmonised Index of Consumer Prices (HICP) (2) year-on-year changes
tableauTable2 – Detailed figures for Core inflation(1) and HICP(2)
| Items | Weight | Index | Percentage change | |
|---|---|---|---|---|
| 2017 | Dec. 2017 | m-on-m change(3) | y-on-y change(4) | |
| Core inflation - All items | 6134 | 101.22 | 0.0 | 0.6 |
| Food excluding fresh products, meat, milk and exotic products | 744 | 100.77 | 0.0 | 0.6 |
| Manufactured products | 2136 | 99.76 | 0.0 | 0.2 |
| Services including actual rentals and services for dwellings | 3254 | 102.35 | −0.1 | 0.8 |
| HICP - All items | 102.16 | 0.4 | 1.2 | |
- * Core inflation indicator excludes public sector prices, the most volatile consumer prices and the tax measures. Seasonally adjusted, this index is calculated for all households in France excluding overseas departments and territories. (in French “indice d'inflation sous-jacent - ISJ”)
- **HICP: Harmonised Indices of Consumer Prices are inflation figures designed for international comparison between Member states of the European Union. This index is calculated for all households in France excluding Mayotte.
- (3) [m/(m-1)]
- (4) [m/(m-12)]
- Source: INSEE - Consumer Price Indices
Revisions
Compared with the provisional estimates published on 5 January 2017, the month-on-month and year-on-year changes in the CPI were confirmed. The month-on-month change in the HICP was down 0.1points, the year-on-year was confirmed.