


 22 December 2017
2017- n° 344At the end of Q3 2017, the Maastricht debt accounted for 98.1% of GDP Debt of the general government according to the Maastricht definition - third quarter
2017
22 December 2017
2017- n° 344At the end of Q3 2017, the Maastricht debt accounted for 98.1% of GDP Debt of the general government according to the Maastricht definition - third quarter
2017
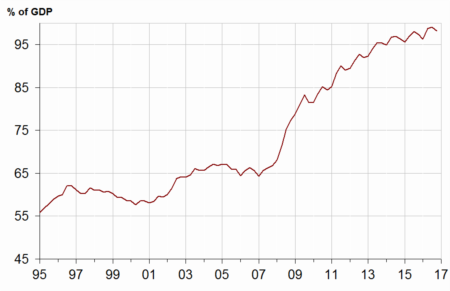
At the end of Q3 2017, the Maastricht debt reached €2,226.1 billion, a €5.5 billion decrease in comparison to Q2 2017. It accounted for 98.1% of gross domestic product (GDP), 1.0 point lower than last quarter. The net public debt declined more slightly (€ −1.5 billion).
- The Maastricht debt decreased by €5.5 billion compared to the previous quarter
- Social security funds debt and local government debt went down
- The State debt went up and central agencies debt remained stable
- In Q3 2017, the net public debt decreased by €1.5 billion
- The overall value of quoted shares and mutual fund shares held by general government increased again

Warnings: Quarterly debt figures are based on an accounting data source less exhaustive than the annual accounts. Results may therefore be updated during several quarters.
Quarterly debt variations are not equal to the forecasted deficit for the current quarter. To obtain the deficit from the change in the Maastricht gross public debt, net acquisitions of financial assets and of liabilities excluded from the Maastricht debt definition must also be taken into consideration, as well as the fact that the Maastricht debt is in nominal value. Moreover, the quarterly deficit published by INSEE is seasonally and trading-day adjusted, which is not the case of the quarterly debt.
The Maastricht debt decreased by €5.5 billion compared to the previous quarter
At the end of Q3 2017, the Maastricht debt reached €2,226.1 billion, a €5.5 billion decrease in comparison to Q2 2017. It accounted for 98.1% of gross domestic product (GDP), 1.0 point lower than last quarter. The net public debt declined more slightly (€ −1.5 billion).
Social security funds debt and local government debt went down
In the third quarter of 2017, the contribution of social security funds to the debt decreased by €8.8 billion, above all because of ACOSS (€ −5.6 billion) that paid off €4.7 billion of Euro Commercial Papers (ECP). CADES (€ −3.4 billion) and CNAF (€ −0.7 billion) reduced their debt to a lesser extent. Conversely, UNEDIC increased its debt (€ +0.7 billion) and hospitals too (€ +0.1 billion).
The contribution of local government to the debt went down by € 1.5 billion: regions reduced their debt by € 0.7 billion and departments by € 0.6 billion.
The State debt went up and central agencies debt remained stable
In Q3 2017, the State contribution to the debt went up to € 4.8 billion. This rise stemmed mainly from the long-term negotiable debt (€ +9.7 billion) and to a lesser extent from deposits at the French Treasury (€ +1.5 billion). The short-term negotiable debt decreased (€ −6.4 billion) and the amounts of loans on the liabilities side of the State are steady.
The contribution of central agencies to the debt remained stable.
graphiqueGraphIR – General government debt under the Maastricht treaty (% of GDP) (*)
tableauTableauA – General government debt under the Maastricht treaty by sub-sector and by category
| 2016Q3 | 2016Q4 | 2017Q1 | 2017Q2 | 2017Q3 | |
|---|---|---|---|---|---|
| General Government | 2,161.0 | 2,147.4 | 2,209.7 | 2,231.7 | 2,226.1 |
| %of GDP | 97.4% | 96.3% | 98.8% | 99.1% | 98.1% |
| of which, by sub-sector : | |||||
| State | 1,722.2 | 1,709.9 | 1,759.4 | 1,790.4 | 1,795.2 |
| Central agencies | 17.2 | 12.7 | 11.7 | 11.5 | 11.04 |
| Local Government | 193.1 | 199.6 | 198.4 | 197.5 | 196.0 |
| Social security funds | 228.5 | 225.2 | 240.2 | 232.4 | 223.5 |
| of which, by category | |||||
| Currency and deposits | 38.1 | 36.5 | 32.8 | 37.0 | 38.4 |
| Securities other than shares | 1,836.6 | 1,817.3 | 1,887.7 | 1,909.1 | 1,904.4 |
| short-term | 180.3 | 168.0 | 195.8 | 198.3 | 185.2 |
| long-term | 1,656.3 | 1,649.3 | 1,691.8 | 1,710.8 | 1,719.2 |
| Loans | 286.3 | 293.6 | 289.2 | 285.6 | 283.3 |
| short-term | 12.6 | 13.3 | 12.2 | 10.3 | 9.1 |
| long-term | 273.8 | 280.3 | 277.0 | 275.3 | 274.2 |
- (*) Explanations in the box "For more details"
- Source: National Accounts 2010 basis - Insee, DGFiP, Banque de France
In Q3 2017, the net public debt decreased by €1.5 billion
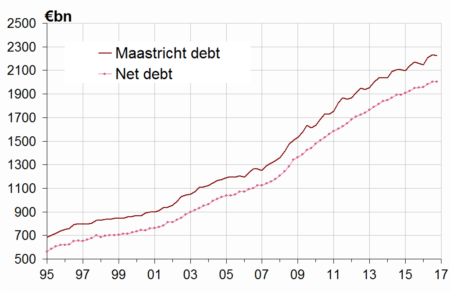
At the end of Q3 2017, the net public debt reached €2,002.6 billion (equivalent to 88.2% of GDP versus 89.0% in Q2 2017), a €1.5 billion decrease compared to the previous quarter. The €4.0 billion gap between changes in net and gross debt is mainly explained by a decrease in the cash position of the State (€ −6.3 billion). Conversely, the cash position of social security founds increased by €5.2 billion. The State also converted into equity €2.0 billion of loans granted to Areva SA at the beginning of 2017.
tableauTableauB – General government net debt by sub-sector
| 2016Q3 | 2016Q4 | 2017Q1 | 2017Q2 | 2017Q3 | |
|---|---|---|---|---|---|
| General government | 1,953.7 | 1,958.5 | 1,983.9 | 2,004.1 | 2,002.6 |
| of which: | |||||
| The State | 1,601.8 | 1,608.3 | 1,625.1 | 1,650.0 | 1,663.6 |
| Central agencies | 3.0 | –1.5 | –1.8 | –1.4 | –1.5 |
| Local government | 180.8 | 187.4 | 186.1 | 185.1 | 183.7 |
| Social security funds | 168.1 | 164.2 | 174.5 | 170.3 | 156.7 |
graphiqueGraph_dette_nette – Maastricht gross debt and net debt
The overall value of quoted shares and mutual fund shares held by general government increased again
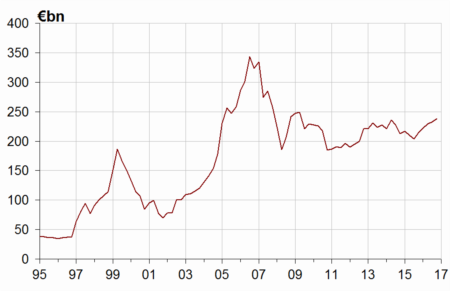
In Q3 2017, the overall value of quoted shares and mutual fund shares held by general government units went up to €238.3 billion, a €5.5 billion increase compared to Q2 2017. In the context of Areva's overhaul, the State bought for €2.5 billion of shares issued by Areva NewCo. He also sold €0.2 billion of Engie shares. Furthermore, the quoted shares held by the State, in particular EDF and Aéroports de Paris, gained €0.4 billion of value due to the rise in stock market prices.
The value of mutual fund shares increased (€ +2.4 billion): the Fonds de réserve pour les retraites (FRR) bought € 0.7 billion of mutual fund shares and the Régime social des indépendants (RSI) € 0.6 billion. Finally, the value of various mutual fund shares held by the general government increased by € 1.0 billion.
tableauTableauC – General government holdings of quoted shares and mutual fund shares
| 2016Q3 | 2016Q4 | 2017Q1 | 2017Q2 | 2017Q3 | |
|---|---|---|---|---|---|
| General government | 214.6 | 221.5 | 229.5 | 232.8 | 238.3 |
| of which: | |||||
| The State | 57.5 | 55.4 | 55.0 | 59.9 | 62.9 |
| Central agencies | 29.3 | 32.1 | 33.1 | 33.3 | 33.8 |
| Local government | 0.1 | 0.1 | 0.1 | 0.1 | 0.1 |
| Social security funds | 127.7 | 133.8 | 141.3 | 139.4 | 141.5 |
graphiqueGraph_F5 – General government holdings of quoted shares and mutual fund shares
Pour en savoir plus
