

 11 August 2017
2017- n° 213In July 2017, consumer prices decreased by 0.3% over a month and rose by 0.7% year
on year Consumer price index - final results - July 2017
11 August 2017
2017- n° 213In July 2017, consumer prices decreased by 0.3% over a month and rose by 0.7% year
on year Consumer price index - final results - July 2017
In July 2017, the Consumer Prices Index (CPI) declined by 0.3% over a month, after a stability in June. Seasonally adjusted, it was unchanged for the second consecutive month. Year on year, consumer prices rose as much as in June (+0.7%).
Monthly change: −0.3%; Year-on-year change: +0.7%
In July 2017, the Consumer Prices Index (CPI) declined by 0.3% over a month, after a stability in June. Seasonally adjusted, it was unchanged for the second consecutive month. Year on year, consumer prices rose as much as in June (+0.7%).
Over a month, the decrease in prices came from a significant downturn in manufactured product prices due to the summer sales and from a further drop in energy prices. Contrariwise, services prices accelerated sharply owing to rising airfares and accommodation prices during summer holidays. Food prices recovered slightly after a downturn in the previous month.
Seasonal fall in manufactured products
Manufactured products prices dropped seasonally in July (−2.9% as in July 2016; −0.4% year-on-year) due to summer sales involving especially clothing and footwear (−14.8% against −14.2% in July 2016; +0.9% year on year). To a lesser extent, the prices of some other types of products diminished with summer sales, such as travel goods (−5.0%; +0.8% year on year), textile household articles (−2.9%; −0.1% year on year), furniture and furnishings (−2.5%; +0.3% year on year), household appliances (−1.3%; −2.3% year on year) and audio-visual, photographic and information processing equipment (−1.0%; −2.3% year on year). In addition, the prices of health products continued to decrease slightly (−0.1%; −2.0% year on year). However, the prices of new motor cars increased a little (+0.2%) owing in particular to tariff changes for some manufacturers.
tableauTable1 – Detailed figures for various groups
| Items | Weight | Index | Percentage change | |
|---|---|---|---|---|
| 2017 | July 2017 | m-on-m change | y-on-y change | |
| a) All households | ||||
| Overall | 10000 | 100.97 | −0.3 | 0.7 |
| Overall SA* | 10000 | 100.98 | 0.0 | 0.7 |
| Food | 1627 | 101.62 | 0.1 | 0.7 |
| Fresh food | 235 | 106.32 | −0.6 | 0.4 |
| Other food | 1392 | 100.88 | 0.2 | 0.8 |
| Tobacco | 188 | 102.54 | 0.0 | 2.4 |
| Manufactured products | 2617 | 96.98 | −2.9 | −0.4 |
| Clothing and footwear | 433 | 89.59 | −14.8 | 0.9 |
| Medical products | 433 | 94.81 | −0.1 | −2.0 |
| Other manufactured products | 1751 | 99.22 | −0.7 | 0.0 |
| Energy | 748 | 99.95 | −1.3 | 1.9 |
| Petroleum products | 378 | 99.31 | −1.5 | 2.6 |
| Services | 4820 | 103.06 | 1.0 | 1.0 |
| Actual rentals and services for dwellings | 779 | 101.06 | 0.0 | 0.5 |
| Health services | 600 | 102.18 | 0.2 | 1.6 |
| Transport | 282 | 107.85 | 7.9 | 2.7 |
| Communication | 242 | 97.63 | 0.0 | −4.8 |
| Other services | 2917 | 103.75 | 0.9 | 1.3 |
| Total except rents and tobacco | 9183 | 100.97 | −0.4 | 0.7 |
| Total except tobacco | 9812 | 100.94 | −0.4 | 0.7 |
| b) Urban working-class households or households of employees | ||||
| All products excluding tobacco | 9710 | 100.62 | −0.6 | 0.6 |
| c) Households that belong to the lowest equivalized disposable income quintile - France | ||||
| All products excluding tobacco | 9705 | 100.52 | −0.5 | 0.6 |
- *: seasonally adjusted
- Geographical coverage: France excluding Mayotte
- Source: INSEE - Consumer Price Indices
Further drop in energy prices
In July 2017, energy prices declined for the fifth consecutive month (−1.3% after −1.5% in May and −1.1% in June). Year on year, they increased by +1.9%, as in the previous month. The further monthly decline in energy prices came from that of petroleum products (−1.5% after −2.2%) and of natural gas and town gas (−3.9%; +4.4% year-on-year). Electricity prices have been unchanged since August 2016.
Hike in service prices
Every year in July, services prices grow during summer holidays (+1.0% as in July 2016, +1.0% year on year). Indeed, the prices of accommodation services increased by 10.5 % over a month, barely more than in July 2016 (+10.3%). Likewise, airfares leapt seasonally in July 2017 (+21.8% over a month against +21.7% in July 2016, +2.5% over a year), as well as package holidays prices (+17,0%; +2.5% year on year). Moreover, insurance prices picked up (+0.4%, +2.4% year-on-year) mostly because of the end of promotional offers on dwelling insurance.
Weak rebound in food prices
In July 2017, food prices slightly recovered slightly (+0.1%) after a seasonal decrease in June (–0.3%). Over a year they rose by 0.7% after +0.8% in June. The slight monthly increase came from that of non fresh products prices (+0.2% over a month after +0.1%, +0.8% over a year), especially owing to a rebound in the prices of bread and cereals (+0.2%) and alcoholic beverages (+0.2%) and to a slight acceleration in the prices of milk, cheese and eggs (+0.2%). Moreover meat prices increased slightly (+0.1%, +1.2% year on year). On the other hand, fresh products prices decreased again (−0.6% after −2.3% in June ; +0.4% over a year), mostly because of fresh fruits (−0.7%) and fresh vegetables (−0.7%).
Slight increase in core inflation over a year
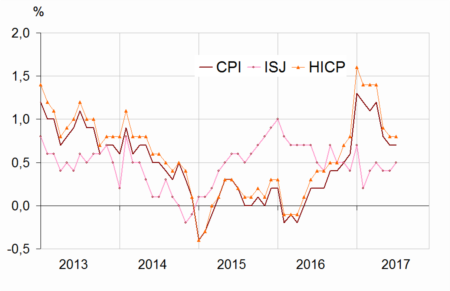
In July 2017, the core inflation indicator (ISJ) remained stable after a 0.1% rise in June. Over a year, it rose by 0.5% slightly faster than in June (+0.4%). The Harmonised Index of Consumer Prices (HICP) decreased by 0.4% over a month ; year on year it increased by 0.8% as in June.
graphiqueGraph1 – Consumer Price Index (CPI), core inflation (ISJ)* and Harmonised Index of Consumer Prices (HICP)** year-on-year changes
tableauTable2 – Detailed figures for Core inflation* and HICP**
| Items | Weight | Index | Percentage change | |
|---|---|---|---|---|
| 2017 | July 2017 | m-on-m change | y-on-y change | |
| Core inflation - All items | 6134 | 101.15 | 0.0 | 0.5 |
| Food excluding fresh products, meat, milk and exotic products | 744 | 100.70 | 0.2 | 0.7 |
| Manufactured products | 2136 | 99.96 | −0.1 | 0.0 |
| Services including actual rentals and services for dwellings | 3254 | 102.01 | 0.1 | 0.8 |
| HICP - All items | 101.17 | −0.4 | 0.8 | |
- * Core inflation indicator excludes public sector prices, the most volatile consumer prices and the tax measures. Seasonally adjusted, this index is calculated for all households in France excluding overseas departments and territories. (in French “indice d'inflation sous-jacent - ISJ”)
- **HICP: Harmonised Indices of Consumer Prices are inflation figures designed for international comparison between Member states of the European Union. This index is calculated for all households in France excluding Mayotte.
- Source: INSEE - Consumer Price Indices
Revisions
Compared with the provisional estimates published on 28 July 2017, the month-on-month and year-on-year changes in the CPI and in the HICP have been confirmed.