


 20 July 2017
2017- n° 188In June 2017, oil price fell again Prices of oil and raw material imports - June 2017
20 July 2017
2017- n° 188In June 2017, oil price fell again Prices of oil and raw material imports - June 2017
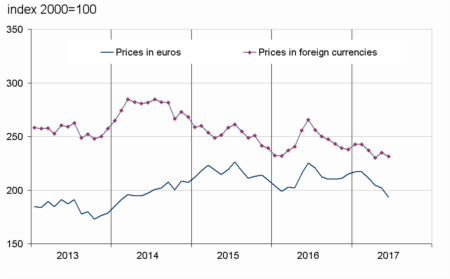
In June 2017, the price of crude oil in euros fell again (−8.8% after −7.1%). The prices in euros of all other imported commodities kept falling for the fourth month in a row (−4.3% after −4.3%). The prices of raw food materials deteriorated further (−4.4% after −1.2%) and those of industrial raw materials decreased sharply again (−4.2% after −6.0%).
In June 2017, the price of crude oil in euros fell again (−8.8% after −7.1%). The prices in euros of all other imported commodities kept falling for the fourth month in a row (−4.3% after −4.3%). The prices of raw food materials deteriorated further (−4.4% after −1.2%) and those of industrial raw materials decreased sharply again (−4.2% after −6.0%).
Oil price fell again
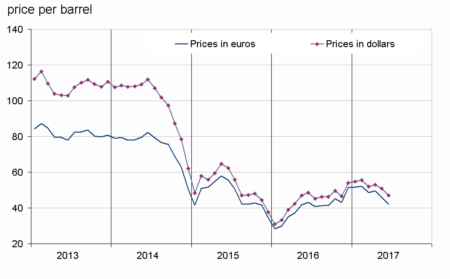
In June 2017, the price of North Sea crude oil (Brent) in euros decreased again clearly (−8.8% after –7.1%). It reached an average of €42 per barrel, its lower level since October 2016. In dollars, the decrease was less marked (−7.4% after −4.1%) because the euro appreciated again during the month.
graphiqueGraph1 – Oil (Brent)
- Source : INSEE
tableauTable1 – Oil and petroleum products
| Prices | Change (%) | |||
|---|---|---|---|---|
| of last month | over the last month | over the last 3 months | over the last 12 months | |
| Brent in $ per barrel | 47.1 | –7.4 | –9.4 | –2.8 |
| Brent in € per barrel | 42.0 | –8.8 | –13.7 | –2.8 |
| Gasoline €/L | 0.343 | –7.6 | –7.2 | –3.4 |
| Gas Oil | 377.8 | –8.1 | –13.0 | –4.6 |
| Heavy fuel | 285.6 | –4.2 | –5.0 | 19.0 |
| Naphtha | 359.7 | –8.3 | –16.7 | –3.6 |
- Prices are in euros per tonne unless otherwise specified
- Source : INSEE
Food commodity prices continued to decrease
In euros, the prices of raw food materials decreased again in June (−4.4% after −1.2%). They reached their lower level since March 2014. The prices of tropical foodstuffs declined more sharply than in May (−4.2% after −3.7%) as well as those of oil seeds and vegetable oils (−5.4% after −1.0%). The price of sugar plummeted more markedly, as a consequence of oversupply (−16.4% after −6.8%). The price of beef meat fell back (+1.8% after +1.6%). Only the prices of cereals increased (+3.4%), more than in May (+1.4%).
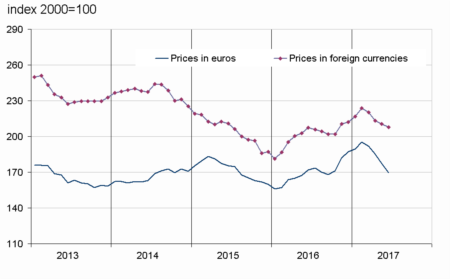
Industrial commodity prices decreased a little less sharply
In June 2017, the prices in euros of industrial raw materials declined less sharply than in June (−4.2% after −6.0%) but it reached its lower level since the beginning of the year. Over the month, minerals prices decreased less sharply (−4.3% after −6.4%). Such is the case of precious metals prices (−1.3% after −6.0%), non-ferrous metals prices (−3.4% after −4.1%), and iron ore price (−9.0% after −15.2%). The prices of agro-industrial raw materials also decreased less markedly (−3.9% after −4.4%), primarily due to the price of wood pulp that recovered (+0.4% after −1.0%). The price of others commodities kept decreasing, whether natural rubber (−8.0% after −8.7%), hide (−4.3% after −11.2%), sawn softwood (−7.9% after −7.3%), tropical wood (−4.0% after −0.8%) or natural fibres prices (−5.9% after −1.5%) .
tableauTable2 – Imported raw materials (excluding energy) in euros
| Index | Changes (%) | |||
|---|---|---|---|---|
| of last month | over the last month | over the last 3 months | over the last 12 months | |
| Food total | 193.2 | –4.4 | –8.4 | –14.2 |
| Tropical foodstuffs | 164.6 | –4.2 | –11.6 | –22.3 |
| Oil seeds, vegetable oils | 215.0 | –5.4 | –10.3 | –18.0 |
| Cereals | 161.6 | 3.4 | 5.7 | –2.5 |
| Sugar | 132.9 | –16.4 | –29.7 | –31.1 |
| Beef meat | 160.2 | –4.1 | –0.8 | 9.0 |
| Industrial raw materials | 163.9 | –4.2 | –13.1 | 7.6 |
| Agricultural raw materials | 124.1 | –3.9 | –5.6 | 9.2 |
| Natural Fibres | 144.7 | –5.9 | –7.7 | 14.5 |
| Natural rubber | 138.8 | –8.0 | –29.0 | 5.7 |
| Hides | 68.1 | –4.3 | –17.7 | –8.4 |
| Wood pulp | 105.5 | 0.4 | 0.9 | 8.6 |
| Tropical wood | 93.6 | –4.0 | –2.7 | –11.3 |
| Sawn softwood | 116.4 | –7.9 | –3.8 | 13.6 |
| Minerals | 186.0 | –4.3 | –15.0 | 7.2 |
| Iron ore | 377.3 | –9.0 | –37.8 | 11.4 |
| Non-ferrous metals | 155.8 | –3.4 | –8.6 | 6.6 |
| Precious metals | 241.0 | –1.3 | –5.1 | 0.0 |
| All commodities | 169.7 | –4.3 | –11.5 | –1.4 |
- Source : INSEE
graphiqueGraph3 – Food
- Source : INSEE
graphiqueGraph2 – Imported raw materials (excluding energy)
- Source : INSEE
graphiqueGraph4 – Industrial raw materials

- Source : INSEE
Pour en savoir plus
Time series : Raw materials prices
