

 13 July 2017
2017- n° 184In June 2017, consumer prices were stable over a month and rose by 0.7% year on year Consumer price index - final results - June 2017
13 July 2017
2017- n° 184In June 2017, consumer prices were stable over a month and rose by 0.7% year on year Consumer price index - final results - June 2017
In June 2017, the Consumer Prices Index (CPI) was stable for the second consecutive month. Seasonally adjusted, it was unchanged too, after a downturn by 0.2% in May. Year on year, consumer prices slowed down slightly (+0.7% after +0.8%).
Monthly change: 0.0%; Year-on-year change: +0.7%
In June 2017, the Consumer Prices Index (CPI) was stable for the second consecutive month. Seasonally adjusted, it was unchanged too, after a downturn by 0.2% in May. Year on year, consumer prices slowed down slightly (+0.7% after +0.8%).
Over a month, the increase in services prices due to a seasonal rebound in airfares was offset by a drop in energy prices and a downturn in food prices. The prices of manufactured products rose barely over a month, as in the two previous months.
Seasonal rise in services prices
In June 2017, services prices increased by 0.3% after having been stable in the previous month. This rise came from a seasonal rebound in airfares (+5.0% after −8.7%; +2.4% year on year). Health services prices rose again (+0.6% after +0.7%), after the rise, in May, in practitioners' consultation fees. Contrariwise, communication services prices fell again sharply (−1.0% as in May, −4.9% year on year), due to a drop in prices of some mobile services fees, and to a lesser extent, to the end of roaming out in Europe. The prices of "other services" slowed down in June (+0.2% after +0.4%): the decline in insurance prices (−0.5% after +0.9%; +2.2% year on year) due to promotional offers for dwelling's insurance was however mitigated by a seasonal acceleration in accomodation services (+3.1% after +1.9%; +0.1% year on year).
tableauTable1 – Detailed figures for various groups
| Items | Weight | Index | Percentage change | |
|---|---|---|---|---|
| 2017 | June 2017 | m-on-m change | y-on-y change | |
| a) All households | ||||
| Overall | 10000 | 101.32 | 0.0 | 0.7 |
| Overall SA* | 10000 | 100.97 | 0.0 | 0.7 |
| Food | 1627 | 101.55 | −0.3 | 0.8 |
| Fresh food | 235 | 106.94 | −2.3 | 1.5 |
| Other food | 1392 | 100.70 | 0.1 | 0.6 |
| Tobacco | 188 | 102.54 | −0.2 | 2.4 |
| Manufactured products | 2617 | 99.91 | 0.1 | −0.3 |
| Clothing and footwear | 433 | 105.20 | 0.4 | 1.7 |
| Medical products | 433 | 94.89 | −0.1 | −2.2 |
| Other manufactured products | 1751 | 99.94 | 0.0 | −0.3 |
| Energy | 748 | 101.27 | −1.1 | 1.9 |
| Petroleum products | 378 | 100.83 | −2.2 | 1.6 |
| Services | 4820 | 101.99 | 0.3 | 0.9 |
| Actual rentals and services for dwellings | 779 | 101.06 | 0.0 | 0.5 |
| Health services | 600 | 101.93 | 0.6 | 1.6 |
| Transport | 282 | 100.00 | 2.1 | 2.2 |
| Communication | 242 | 97.61 | −1.0 | −4.9 |
| Other services | 2917 | 102.80 | 0.2 | 1.3 |
| Total except rents and tobacco | 9183 | 101.35 | 0.0 | 0.7 |
| Total except tobacco | 9812 | 101.30 | 0.0 | 0.7 |
| b) Urban working-class households or households of employees | ||||
| All products excluding tobacco | 9710 | 101.18 | 0.0 | 0.6 |
| c) Households that belong to the lowest equivalized disposable income quintile - France | ||||
| All products excluding tobacco | 9705 | 100.98 | 0.0 | 0.6 |
- *: seasonally adjusted
- Geographical coverage: France excluding Mayotte
- Source: INSEE - Consumer Price Indices
Further drop in energy prices
In June 2017, energy prices declined for the fourth consecutive month (−1.1% after −0.3% in April and −1.5% in May). Year on year, they slowed down significantly to +1.9%, lower increase since October 2016. The further monthly decline in energy prices came totally from that of petroleum products (−2.2% after −2.1%). Prices in natural gas and town gas prices were stable in June (+9.0% year on year). Electricity prices have been unchanged since August 2016.
Seasonal downturn in fresh product prices
In June 2017, food prices edged down by 0.3% after a rebound of 0.7% in May. Year on year, they accelerated to +0.8% after +0.4% in May. The monthly downturn was due to that, seasonal, of fresh product prices (−2.3% over a month). Year on year, fresh product prices revovered (+1.5%) after a one-time drop of 0.3% in May. Excluding fresh products, food prices barely decelerated (+0.1% over a month after +0.2%, +0.6% year on year), due to a slowdown in meat prices (+0.2% after +0.4%; +1.2% year on year).
Tobacco prices declined again slightly over a month. Year on year, their rise remained sustained at +2.4%.
Slight increase in manufactured products prices
The prices of manufactured products rose little in June 2017 (+0.1% as in the two previous months). Year on year, their drop was again less pronounced (−0.3% after −0.7%). Over a month, clothing and footwear prices barely slowed down (+0.4% after +0.5%). Summer sales beginning later than in the previous year, their prices rebounded to +1.7% year on year after −0.5% in May. The prices of “other manufactured goods” were stable after +0.1% in the previous month (−0.3% year on year). The prices of health products declined by 0.1% as in May.
Slight increase in core inflation over a year
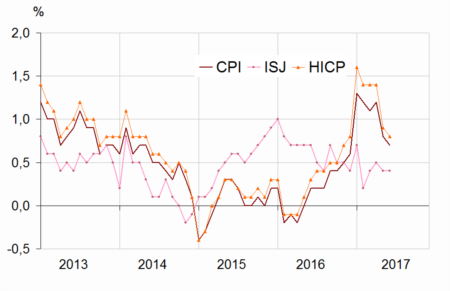
In June 2017, the core inflation indicator (ISJ) was rose by 0.1% after having been stable in May. Year on year, it increased at the same pace than in the previous month (+0.4%). The Harmonised Index of Consumer Prices (HICP) was unchanged as in the pevious month; year on year, it slowed down very slightly (+0.8%, after +0.9%).
graphiqueGraph1 – Consumer Price Index (CPI), core inflation (ISJ)* and Harmonised Index of Consumer Prices (HICP)** year-on-year changes
tableauTable2 – Detailed figures for Core inflation* and HICP**
| Items | Weight | Index | Percentage change | |
|---|---|---|---|---|
| 2017 | June 2017 | m-on-m change | y-on-y change | |
| Core inflation - All items | 6134 | 101.11 | 0.1 | 0.4 |
| Food excluding fresh products, meat, milk and exotic products | 744 | 100.50 | 0.0 | 0.5 |
| Manufactured products | 2136 | 100.05 | 0.4 | 0.0 |
| Services including actual rentals and services for dwellings | 3254 | 101.94 | 0.0 | 0.7 |
| HICP - All items | 101.58 | 0.0 | 0.8 | |
- * Core inflation indicator excludes public sector prices, the most volatile consumer prices and the tax measures. Seasonally adjusted, this index is calculated for all households in France excluding overseas departments and territories. (in French “indice d'inflation sous-jacent - ISJ”)
- **HICP: Harmonised Indices of Consumer Prices are inflation figures designed for international comparison between Member states of the European Union. This index is calculated for all households in France excluding Mayotte.
- Source: INSEE - Consumer Price Indices
Revisions
Compared with the provisional estimates published on 30 June 2017, the month-on-month and year-on year changes in the CPI and in the HICP have not been revised.