

 30 May 2017
2017- n° 139French GDP increased by 0.4% in Q1 2017 Quarterly national accounts - second estimate - first quarter 2017
30 May 2017
2017- n° 139French GDP increased by 0.4% in Q1 2017 Quarterly national accounts - second estimate - first quarter 2017
In Q1 2017, GDP in volume terms* rose barely less fast (+0.4%) than in Q4 2016 (+0.5%). Households' consumption expenditure stalled (+0.1% after +0.6%). By contrast, total gross fixed capital formation (GFCF) accelerated sharply (+1.2% after +0.5%). All in all, final domestic demand excluding inventory changes barely slowed: it brought +0.4 points to GDP growth, after +0.5 points in the previous quarter.
Exports fell back significantly (−0.8% after +1.0%) while imports accelerated (+1.4% after +0.6%). All in all, foreign trade balance weighed down on GDP growth: −0.7 points after +0.1 points in the previous quarter. Conversely, changes in inventories contributed positively (+0.7 points after −0.2 points).

* This growth rate is seasonally and working-day adjusted; volumes are chain-linked previous-year-prices volumes.
graphiqueGraph – GDP and its main components
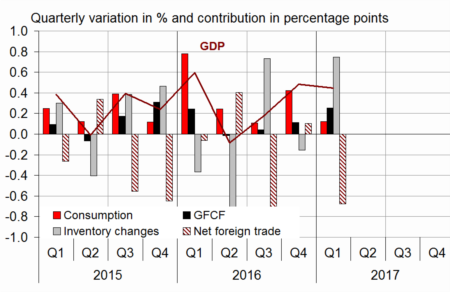
- Source: INSEE
tableauTab1 – GDP and its main components: chain-linked volumes
| 2016 Q2 | 2016 Q3 | 2016 Q4 | 2017 Q1 | 2016 | 2017 (ovhg) | |
|---|---|---|---|---|---|---|
| GDP | -0.1 | 0.2 | 0.5 | 0.4 | 1.1 | 0.9 |
| Imports | -1.1 | 2.8 | 0.6 | 1.4 | 4.2 | 3.0 |
| Household consumption *expenditure | 0.3 | 0.1 | 0.6 | 0.1 | 2.1 | 0.7 |
| General government's *consumption expenditure | 0.3 | 0.3 | 0.3 | 0.3 | 1.2 | 0.8 |
| GFCF | -0.1 | 0.2 | 0.5 | 1.2 | 2.7 | 1.6 |
| *of which Non-financial corporated and unincorporated enterprises | -0.3 | -0.2 | 0.9 | 1.9 | 3.4 | 2.4 |
| Households | 0.7 | 0.9 | 0.9 | 1.0 | 2.4 | 2.3 |
| General government | -0.6 | 0.0 | -1.5 | -1.2 | -0.2 | -2.5 |
| Exports | 0.2 | 0.6 | 1.0 | -0.8 | 1.9 | 0.3 |
| Contributions : | ||||||
| Internal demand excluding inventory changes | 0.2 | 0.1 | 0.5 | 0.4 | 2.0 | 0.9 |
| Inventory changes | -0.7 | 0.7 | -0.2 | 0.7 | -0.1 | 0.9 |
| Net foreign trade | 0.4 | -0.7 | 0.1 | -0.7 | -0.8 | -0.9 |
- Source: INSEE
Total production slowed slightly
Production of goods and services slowed down slightly in Q1 2017 (+0.5% after +0.7%). It fell back in goods (−0.2% after +1.0%) while it increased almost at the same pace as in the previous quarter in services (+0.7% after +0.6%).
Manufacturing output fell back (−0.2% after +0.7%), mainly due to a sharp decline in the coke and refined petroleum branch and a slowdown in transport equipment. Electricity and gas production also shrank. In the construction branch, production slowed slightly (+0.3% after +0.6%). Conversely, it accelerated in market services (+0.9% after +0.6%).
Household consumption weakened
Household consumption expenditure stalled in Q1 2017 (+0.1% after +0.6%): a sharp downturn in goods (−0.4% after +1.0%) dominated a slight acceleration in services (+0.5% after +0.3%).
In particular, expenditure on energy fell back strongly (−3.3% after +3.4%): temperatures in winter 2017 were rather mild for the season, after a cool autumn 2016. Consumption of engineered goods decelerated (+0.1% after +1.1%), mainly due to a decline in vehicle purchases. By contrast, consumption of food products recovered (+0.4% after −0.2%).
tableauTab2 – Sectoral accounts
| 2016 Q2 | 2016 Q3 | 2016 Q4 | 2017 Q1 | 2015 | 2016 | |
|---|---|---|---|---|---|---|
| Profit ratio of NFCs* (level) | 31.8 | 31.7 | 31.8 | 31.9 | 31.9 | |
| Households' purchasing power | 0.3 | 0.6 | 0.1 | 0.8 | 1.8 |
- *NFCs: non-financial corporations
- Source: INSEE
tableauTab3 – Production, consumption and GFCF: main components
| 2016 Q2 | 2016 Q3 | 2016 Q4 | 2017 Q1 | 2016 | 2017 (ovhg) | |
|---|---|---|---|---|---|---|
| Production of branches | -0.3 | 0.3 | 0.7 | 0.5 | 0.9 | 1.0 |
| Goods | -0.7 | 0.2 | 1.0 | -0.2 | 0.2 | 0.5 |
| Manufactured Industry | -0.9 | 0.7 | 0.7 | -0.2 | 0.8 | 0.4 |
| Construction | -0.3 | 0.3 | 0.6 | 0.3 | 0.1 | 0.9 |
| Market services | -0.3 | 0.4 | 0.6 | 0.9 | 1.4 | 1.4 |
| Non-market services | 0.2 | 0.2 | 0.3 | 0.3 | 1.0 | 0.6 |
| Household consumption | 0.3 | 0.1 | 0.6 | 0.1 | 2.1 | 0.7 |
| Food products | -0.3 | 0.6 | -0.2 | 0.4 | 0.9 | 0.5 |
| Energy | 1.3 | -1.3 | 3.4 | -3.3 | 2.2 | -1.1 |
| Engineered goods | 0.4 | -1.2 | 1.1 | 0.1 | 2.4 | 0.4 |
| Services | 0.0 | 0.5 | 0.3 | 0.5 | 1.6 | 1.0 |
| GFCF | -0.1 | 0.2 | 0.5 | 1.2 | 2.7 | 1.6 |
| Manufactured goods | -1.1 | -2.0 | 0.4 | 1.6 | 6.1 | 0.6 |
| Construction | 0.0 | 0.2 | 0.5 | 0.3 | 0.2 | 0.8 |
| Market services | 0.5 | 1.7 | 0.7 | 1.9 | 3.9 | 3.4 |
- Source: INSEE
tableauTab4 – Households' disposable income and ratios of households' account
| 2016 Q2 | 2016 Q3 | 2016 Q4 | 2017 Q1 | 2015 | 2016 | |
|---|---|---|---|---|---|---|
| HDI | 0.3 | 0.7 | 0.4 | 1.1 | 1.7 | |
| Household purchasing power | 0.3 | 0.6 | 0.1 | 0.8 | 1.8 | |
| HDI by cu* (purchasing power) | 0.2 | 0.5 | 0.0 | 0.4 | 1.4 | |
| Adjusted HDI (purchasing power) | 0.3 | 0.6 | 0.1 | 1.0 | 1.7 | |
| Saving rate (level) | 13.8 | 14.3 | 13.9 | 14.3 | 14.0 | |
| Financial saving rate (level) | 4.5 | 5.1 | 4.5 | 5.0 | 4.7 |
- *cu: consumption unit
- Source: INSEE
tableauTab5 – Ratios of non-financial corporations' account
| 2016 Q2 | 2016 Q3 | 2016 Q4 | 2017 Q1 | 2015 | 2016 | |
|---|---|---|---|---|---|---|
| Profit share | 31.8 | 31.7 | 31.8 | 31.9 | 31.9 | |
| Investment ratio | 23.4 | 23.3 | 23.4 | 22.9 | 23.3 | |
| Savings ratio | 19.5 | 19.5 | 19.6 | 19.3 | 19.7 | |
| Self-financing ratio | 83.6 | 83.7 | 84.1 | 84.4 | 84.3 |
- Source: INSEE
tableauTab6 – Expenditure, receipts and net borrowing of public administrations
| 2016 Q2 | 2016 Q3 | 2016 Q4 | 2017 Q1 | 2015 | 2016 | |
|---|---|---|---|---|---|---|
| In billions of euros | ||||||
| Total expenditure | 315.7 | 317.2 | 316.8 | 1244.0 | 1257.0 | |
| Total receipts | 296.6 | 296.5 | 298.9 | 1165.3 | 1181.2 | |
| Net lending (+) or borrowing (-) | -19.1 | -20.7 | -18.0 | -78.7 | -75.8 | |
| In % of GDP | ||||||
| Net lending (+) or borrowing (-) | -3.4 | -3.7 | -3.2 | -3.6 | -3.4 |
- Source: INSEE
Corporate investment accelerated, household investment kept on growing strongly
In Q1 2017, total GFCF accelerated sharply (+1.2% after +0.5%), especially that of enterprises (+1.9% after +0.9%). Investment of households kept on increasing vigorously (+1.0% after +0.9%). Investment in manufactured goods was more dynamic (+1.6% after +0.4%), notably in equipment goods. Similarly, GFCF in market services accelerated sharply (+1.9% after +0.7%), notably in information-communication and business services. Investment in construction decelerated slightly (+0.3% after +0.5%).
Foreign trade balance weighed down on GDP growth
Exports fell back in Q1 2017 (−0.8% after +1.0%), especially in transport equipment and “other manufactured goods”. Imports accelerated (+1.4% after +0.6%): in particular, purchases of refined petroleum products bounced back and those in “other industrial goods” increased more vigorously. All in all, foreign trade balance weighed down on GDP growth by −0.7 points, after a contribution of +0.1 points in the previous quarter.
Changes in inventories increased significantly
In Q1 2017, the contribution of changes in inventories to GDP growth amounted to +0.7 points (after −0.2 points at the end of 2016). They increased especially in transport equipment and “other industrial goods” (pharmaceuticals, metallurgy and chemicals).
The GDP profile has been revised over the past
The extent of the revisions compared to the previous estimate is typical at this time of year: it results from the benchmarking on the annual accounts revised on years 2016 (GDP growth unchanged, at +1.1% WDA), 2015 (−0.2 points at +1.0%) and 2014 (+0.3 points at +1.0%) and from updates of seasonal and working day adjustments as well as revision of indicators. The GDP growth for Q1 2017 is raised from +0.3% to +0.4%.
Pour en savoir plus
Time series : Operations on goods and services
Time series : Gross domestic product balance
Time series : Institutional sector accounts
Time series : Branch accounts