

 23 February 2017
2017- n° 46In February 2017, the business climate in manufacturing remains well above normal Monthly business survey (goods-producing industries) - February 2017
23 February 2017
2017- n° 46In February 2017, the business climate in manufacturing remains well above normal Monthly business survey (goods-producing industries) - February 2017
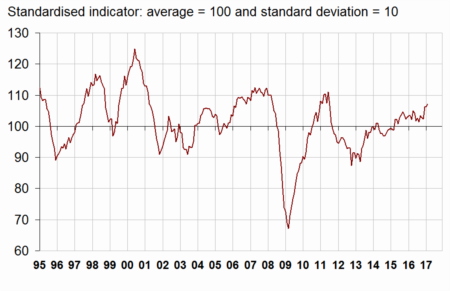
According to the business managers surveyed in February 2017, the business climate in industry has gained one point. At 107, it stands at its highest level since June 2011, significantly above its long-term average (100).
- Industrialists' optimism about personal production expectations keeps growing
- In the manufacture of food products and beverages, the business climate is less favourable
- In the manufacture of machinery and equipment goods, the business climate has gained one point
- The business climate remains significantly above normal in the manufacture of transport equipment
- The business climate stands at its highest level since June 2011 in “other manufacturing”
According to the business managers surveyed in February 2017, the business climate in industry has gained one point. At 107, it stands at its highest level since June 2011, significantly above its long-term average (100).
graphiqueGraph 1 – Business climate in industry - Composite indicator
The turning-point indicator remains in the zone indicating a further favourable economic outlook.
graphiqueGraph 2 – Turning-point indicator
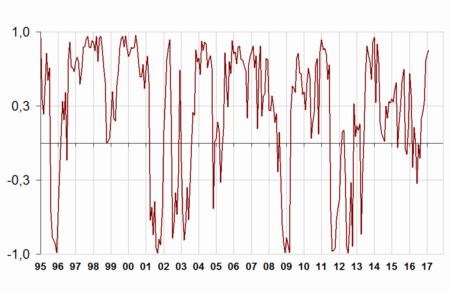
- How to read it: close to 1 (respectively −1), the indicator points to a favourable short-term economic situation (respectively unfavourable). Between −0.3 and +0.3: uncertainty area.
Industrialists' optimism about personal production expectations keeps growing
In February 2017, the balance of opinion on past activity has fallen back again albeit remaining slightly above normal. However, business managers are more upbeat on their personal production expectations: the balance has increased for the third month in a row and has reached its highest level since January 2008, significantly above its mean.
Business managers are a little less upbeat on general production prospects for the sector. The corresponding balance has slightly decreased but remains significantly above its long-term average, that it has exceeded since February 2015.
In February, the balances on global and export order books have slightly increased and stand at their highest level since June 2011, significantly above normal.
Finally, slightly more industrialists than in January consider that finished-goods inventories are below normal: the corresponding balance, already below its long-term average, has deviated a little more.
tableauTable 1 – Industrialists' opinion on manufacturing activity
| Manufacturing industry | Ave.* | Nov. 16 | Dec. 16 | Jan. 17 | Feb. 17 |
|---|---|---|---|---|---|
| Composite indicator | 100 | 102 | 106 | 106 | 107 |
| Past activity | 4 | 8 | 19 | 12 | 6 |
| Finished-goods inventory | 13 | 7 | 8 | 6 | 5 |
| Global order books | –18 | –16 | –10 | –10 | –8 |
| Export order books | –14 | –11 | –9 | –4 | –3 |
| Personal production expectations | 5 | 5 | 8 | 13 | 20 |
| General production expectations | –9 | 3 | 6 | 7 | 5 |
- * Long-term average since 1976.
- Source: INSEE - Monthly business tendency survey in industry
The slight increase of the business climate in industry mainly comes from an improvement in the machinery and equipment industry, partly offset by a decrease in the manufacture of food products and beverages.
In the manufacture of food products and beverages, the business climate is less favourable
In the manufacture of food products and beverages, the business climate has decreased by two points in February but remains above its long-term average. This downturn mainly comes from a decrease in the balance of opinion on past activity.
In the manufacture of machinery and equipment goods, the business climate has gained one point
In the manufacture of machinery and equipment goods, the business climate, already at its highest level since June 2011 and significantly above normal, has increased by one point. This improvement mainly stems from the balance on global order books.
In machinery and equipment, the business climate has bounced back hitting 104, its highest level since July 2011. In electrical equipment, it is virtually stable at its highest level since August 2011. However, in the computer, electronic and optical product industry, the climate has slightlydeteriorated. Those three sub-sectors climates are above normal in February.
The business climate remains significantly above normal in the manufacture of transport equipment
In the manufacture of transport equipment, the business climate is stable significantly above normal. A decrease in the balance on past activity is offset by an increase in that on personal production expectations.
In the manufacture of motor vehicles, trailers and semi-trailers as in other transport equipment, the business climate is stable above normal.
The business climate stands at its highest level since June 2011 in “other manufacturing”
In overall “other manufacturing”, the business climate is stable. It had reached in January its highest level since June 2011, significantly above normal. In February, a decrease in the balance on past activity is offset by a further increase in those on order books.
In chemicals, the business climate has brightened again, hitting its highest level since May 2006, significantly above normal. In wood-paper it has slightly improved again.
It is virtually stable, significantly above normal in clothing-textiles and in rubber and plastic products, and closed to normal in “other manufacturing industries”. However, in basic metals the business climate has edged down, albeit remaining significantly above normal.
graphiqueGraph 3 – Business climates in a sector-based approach
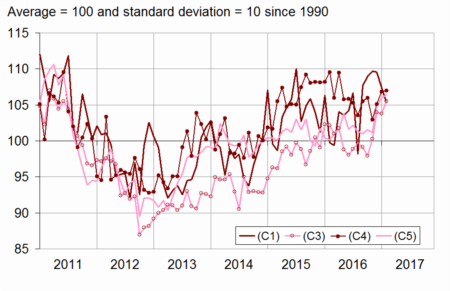
- Legend: (C1): Manufacture of food products and beverages - (C3): Machinery and equipment goods - (C4): Manufacture of transport equipment - (C5): Other manufacturing
tableauTable 2 – Business climates in a sector-based approach
| NA* : (A17) et [A38 et A64] | Weights** (%) | Dec. 16 | Jan. 17 | Feb. 17 |
|---|---|---|---|---|
| (C1) Man. of food products and beverages | 21 | 110 | 107 | 105 |
| (C3) Machinery and equipment goods | 11 | 104 | 104 | 105 |
| [CI] Computer, electronic and optical products | 3 | 111 | 110 | 108 |
| [CJ] Electrical equipment | 3 | 100 | 102 | 103 |
| [CK] Machinery and equipment | 5 | 103 | 100 | 104 |
| (C4) Man. of transport equipment | 15 | 105 | 107 | 107 |
| [CL1] Motor vehicles, trailers and semi-trailers | 7 | 104 | 108 | 108 |
| [CL2] Other transport equipment | 8 | 104 | 104 | 104 |
| (C5) Other manufacturing | 46 | 105 | 106 | 106 |
| [CB] Textiles, clothing industries, leather and footwear industry | 2 | 112 | 108 | 109 |
| [CC] Wood, paper, printing | 5 | 103 | 106 | 107 |
| [CE] Chemicals and chemical products | 9 | 103 | 106 | 110 |
| [CG] Rubber and plastic products | 7 | 106 | 106 | 106 |
| [CH] Basic metals and fabricated metal products | 11 | 104 | 105 | 103 |
| [CM] Other manufacturing industries | 9 | 99 | 100 | 99 |
- * NA: aggregated classification, based on the French classification of activities NAF rév.2.
- ** Weights used to aggregate sub-sector's balances of opinion.
- Source: INSEE - Monthly business tendency survey in industry
Documentation
Methodology (pdf,133 Ko)
Pour en savoir plus
Time series : Industry - Activity and demand