

 21 February 2017
2017- n° 44In January 2017, oil prices stabilised virtually Prices of oil and raw material imports - January 2017
21 February 2017
2017- n° 44In January 2017, oil prices stabilised virtually Prices of oil and raw material imports - January 2017
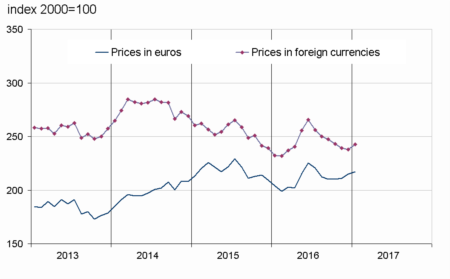
In January 2017, the price of crude oil in euros stabilised virtually (+0.7% after +19.1%). It reached an average of €51.6 per barrel, hitting its higher level since July 2015. The prices in euros of all other imported commodities slowed (+1.3% after +2.9% in December), especially those of industrial raw materials (+1.4% after +3.5%). The prices of raw food materials were less vigorous (+1.1% after +1.8%).
In January 2017, the price of crude oil in euros stabilised virtually (+0.7% after +19.1%). It reached an average of €51.6 per barrel, hitting its higher level since July 2015. The prices in euros of all other imported commodities slowed (+1.3% after +2.9% in December), especially those of industrial raw materials (+1.4% after +3.5%). The prices of raw food materials were less vigorous (+1.1% after +1.8%).
Oil price stabilised virtually
In January, the price of North Sea crude oil (Brent) in euros stabilised virtually (+0.7%), after an upsurge in December (+19.1%). In dollars, it increased moderatly (+1.5% after +16.4%) because the euro appreciated slightly during the month.
graphiqueGraph1 – Oil (Brent)
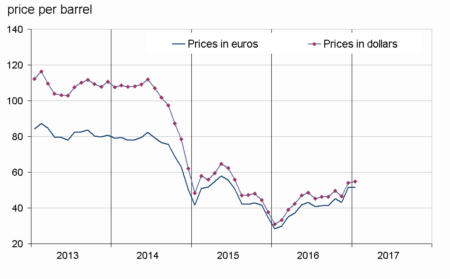
- Source : INSEE
tableauTable1 – Oil and petroleum products
| Prices | Change (%) | |||
|---|---|---|---|---|
| of last month | over the last month | over the last 3 months | over the last 12 months | |
| Brent in $ per barrel | 54.9 | 1.5 | 10.4 | 78.2 |
| Brent in € per barrel | 51.6 | 0.7 | 14.4 | 81.9 |
| Gasoline €/L | 0.405 | –1.3 | 10.7 | 59.9 |
| Gas Oil | 458.2 | –0.2 | 9.1 | 71.1 |
| Heavy fuel | 313.8 | –2.4 | 18.6 | 97.3 |
| Naphtha | 466.8 | 7.0 | 17.0 | 53.5 |
- Prices are in euros per tonne unless otherwise specified
- Source : INSEE
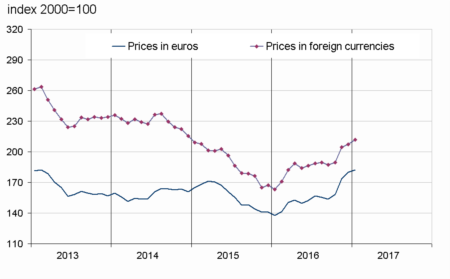
Industrial commodity prices slowed again
The prices in euros of industrial raw materials slowed again in January (+1.4% after +3.5% in the previous month). Agricultural raw materials prices rose much less quickly (+0.2% after +5.2%). The price of hides slid more sharply (−1.2 % after −0.2 %). The price of wood pulp edged down (−0.8 % after +2.3 %). The price of sawn softwood plummeted (−4.0 % after +6.7 %), tropical wood fell back too (−2.1 % after +2.7 %). However, the price of rubber kept increasing strongly (+13.2 % after +13.6 %), because of heavy rains in Thaïland that hindered crops. Minerals prices slowed again (+1.7 % after +3.1 %), since the price of iron decelerated sharply (+0.9% after +12.9%). Nevertheless, non-ferrous metals prices gathered pace (+1.7% after +1.0%). The prices of precious metals recovered (+4.3% after −4.0%), especially the price of palladium (+10.0% after −9.7%) buoyed by an increasing demand of the automotive industry combined with a chronic supply deficit.
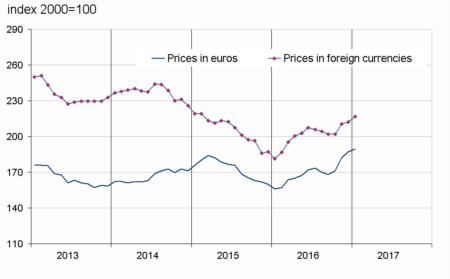
Raw food material prices slackened
In euros, the prices of raw food materials grew more moderately than in December (+1.1% after +1.8%). The price rise of oil seeds and vegetable oils eased (+1.5% after +4.0%) as those of cereals (+1.4% after +4.0%). The price of beef meat fell back (−2.9% after +14.2%). However, the price of sugar bounced back (+8.2%) after a two-month strong decline, and the prices of tropical foodstuffs recovered (+0.9 % after −6.0%).
tableauTable2 – Imported raw materials (excluding energy) in euros
| Index | Changes (%) | |||
|---|---|---|---|---|
| of last month | over the last month | over the last 3 months | over the last 12 months | |
| Food total | 217.2 | 1.1 | 3.4 | 6.5 |
| Tropical foodstuffs | 196.8 | 0.9 | –7.0 | –3.5 |
| Oil seeds, vegetable oils | 249.3 | 1.5 | 9.0 | 18.5 |
| Cereals | 154.8 | 1.4 | 6.0 | 4.0 |
| Sugar | 216.4 | 8.2 | –7.1 | 46.7 |
| Beef meat | 150.4 | –2.9 | 13.2 | –11.2 |
| Industrial raw materials | 182.5 | 1.4 | 15.5 | 32.6 |
| Agricultural raw materials | 126.3 | 0.2 | 7.4 | 19.0 |
| Natural Fibres | 148.5 | 3.0 | 8.8 | 21.9 |
| Natural rubber | 215.6 | 13.2 | 42.0 | 96.1 |
| Hides | 81.1 | –1.2 | 3.3 | 3.4 |
| Wood pulp | 103.2 | –0.8 | 3.7 | 4.0 |
| Tropical wood | 96.7 | –2.1 | 3.5 | –12.7 |
| Sawn softwood | 104.9 | –4.0 | 0.6 | 22.0 |
| Minerals | 212.1 | 1.7 | 17.7 | 36.9 |
| Iron ore | 565.3 | 0.9 | 45.0 | 100.8 |
| Non-ferrous metals | 167.0 | 1.7 | 12.6 | 25.7 |
| Precious metals | 249.3 | 4.3 | 1.4 | 17.7 |
| All commodities | 189.6 | 1.3 | 10.9 | 21.7 |
- Source : INSEE
graphiqueGraph3 – Food
- Source : INSEE
graphiqueGraph2 – Imported raw materials (excluding energy)
- Source : INSEE
graphiqueGraph4 – Industrial raw materials
- Source : INSEE
Pour en savoir plus
Time series : Raw materials prices