

 17 July 2015
2015- n° 174In June 2015, oil prices fell back Prices of oil and raw material imports - June 2015
17 July 2015
2015- n° 174In June 2015, oil prices fell back Prices of oil and raw material imports - June 2015
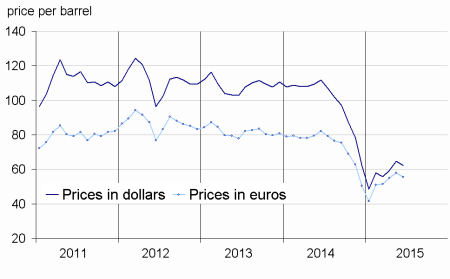
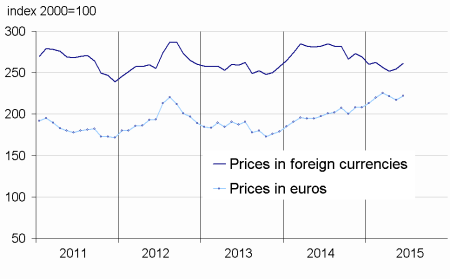
In June 2015, the price of crude oil in euros fell back (-3.9% after +5.4%), to average 55.6€ per barrel of Brent. The price tumbled by 32.4% compared to its level in June 2014, when it stood at 82.3€. Prices in euros of imported commodities except energy decreased again (-1.1% after –1.9%), due to the drop in industrial raw materials (-3.8%), while prices of raw food materials climbed (+2.2%).
In June 2015, the price of crude oil in euros fell back (-3.9% after +5.4%), to average 55.6€ per barrel of Brent. The price tumbled by 32.4% compared to its level in June 2014, when it stood at 82.3€. Prices in euros of imported commodities except energy decreased again (-1.1% after –1.9%), due to the drop in industrial raw materials (-3.8%), while prices of raw food materials climbed (+2.2%).
Oil prices in euros went down
In June, the price of crude oil from the North Sea (Brent) in dollars fell back (-3.4% after +8.7%), in particular as a result of high production prospects from Opec members and in the USA, whereas demand prospects dipped, in particular in China. In euros, the price of crude Brent fell back as well (–3.9% after +5.4%). Still, temporary imbalances in the refining industry entailed an increase in gasoline prices in euros (+3.0%).
Prices of industrial raw materials dipped again
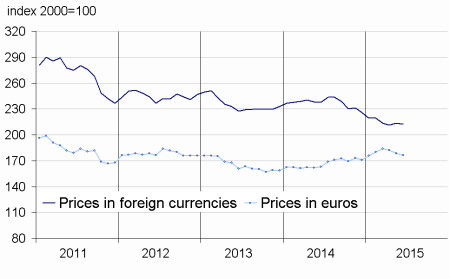
In June, prices of industrial raw materials in euros went down again (–3.8% after -1.9% in May), due to a drop in the prices of minerals. Yet, year-on-year, prices increased (+4.4%), due to the depreciation of the euro since then.
Prices of minerals kept falling (-5.9% after -1.4%), due to a further decline in prices of non-ferrous metals (-7.1% after –2.9%) and of precious metals (-4.6% after -3.1%). In particular, prices of nickel fell back (-5.7% after +2.2%), due to high stockpiling on a worldwide scale. Prices of aluminum kept dropping (-7.3% after -3.4%), as a result of a plentiful world output. Among precious metals, those of palladium plummeted (-13.6% after -3.0%) and those of gold decreased less sharply (-2.0% after -3.2%). On the other hand, prices of iron ore are still recovering (+2.9% after +14.2%; -18.6% over a year).
Prices of agricultural raw materials rallied (+3.0% after –3.4%), due to sawn softwood prices (+12.6% after -4.7%). On the contrary, prices of wood pulp declined (-0.7%), along with those of natural rubber (-0.6%) and of natural fibres (–1.1%).
Prices of raw food materials recovered
In June, prices of raw food materials picked up (+2.2% after -2.0%), in particular those of oil seeds and vegetable oils (+2.3% after -3.1%), as a result of an increasing demand for palm oil, in particular from China and India. Prices of tropical foodstuffs accelerated (+4.3% after +1.4%), particularly those of tea (+12.8% after +4.7%). Prices of cocoa remained buoyant (+4.8% after +4.1%), in particular as a result of adverse weather conditions affecting crops in Ghana.
tableautabpetrole – Oil and petroleum products
| Prices | Change (%) | |||
|---|---|---|---|---|
| of last month | over the last month | over the last 3 months | over the last 12 months | |
| Brent in $ per barrel | 62.4 | –3.4 | 11.8 | –44.2 |
| Brent in € per barrel | 55.6 | –3.9 | 7.8 | –32.4 |
| Gasoline €/L | 0.47 | 3.0 | 14.4 | –16.9 |
| Gas Oil | 516.9 | –3.9 | 2.6 | –22.9 |
| Heavy fuel | 325.9 | –1.3 | 12.6 | –28.1 |
| Naphtha | 483.8 | –2.8 | 3.2 | –31.0 |
- Prices are in euros per tonne unless otherwise specified
- Source: INSEE
tableautabmatprem – Imported raw materials (excluding energy) in euros
| Index | Changes (%) | |||
|---|---|---|---|---|
| over the last month | over the last 3 months | over the last 12 months | ||
| Food total | 222.0 | 2.2 | –1.6 | 12.5 |
| Tropical foodstuffs | 219.6 | 4.3 | 4.6 | 23.6 |
| Oil seeds, vegetable oils | 237.9 | 2.3 | –3.5 | –2.2 |
| Cereals | 147.2 | –1.9 | –9.8 | 4.0 |
| Sugar | 117.3 | –8.0 | –11.8 | –17.3 |
| Beef meat | 188.1 | 1.7 | –3.3 | 32.0 |
| Industrial raw materials | 160.8 | –3.8 | –6.1 | 4.4 |
| Agricultural raw materials | 115.4 | 3.0 | –4.7 | 12.0 |
| Natural fibres | 125.4 | –1.1 | 2.8 | –0.1 |
| Natural rubber | 177.2 | –0.6 | 5.4 | –2.9 |
| Hides | 96.2 | –2.5 | –12.6 | 5.4 |
| Wood pulp | 103.0 | –0.7 | –7.2 | 11.6 |
| Tropical wood | 115.6 | 0.1 | 0.1 | 11.5 |
| Sawn softwood | 93.1 | 12.6 | –2.0 | 8.8 |
| Minerals | 185.7 | –5.9 | –6.6 | 2.3 |
| Iron ore | 411.2 | 2.9 | 5.5 | –18.6 |
| Non-ferrous metals | 155.2 | –7.1 | –8.1 | 5.2 |
| Precious metals | 235.7 | –4.6 | –5.9 | 4.5 |
| All commodities | 176.5 | –1.1 | –4.1 | 8.2 |
- Source: INSEE
graphiqueG_petrole_ang – Oil (Brent)
- Source: INSEE
graphiqueG_alim_ang – Food
- Source: INSEE
graphiqueG_ensemble_ang – Imported raw materials (excluding energy)
- Source: INSEE
graphiqueG_indus_ang – Industrial raw materials

- Source: INSEE
Pour en savoir plus
Time series : Raw materials prices