

 15 November 2013
2013- n° 263In October 2013, the price of crude oil fell Prices of oil and raw material imports - October 2013
15 November 2013
2013- n° 263In October 2013, the price of crude oil fell Prices of oil and raw material imports - October 2013
In October, the crude oil price in euros fell (-4.0%), reaching € 80.2 per barrel of Brent. The euro prices of commodities except energy imported into France also decreased (-2.2%), essentially due to the decline of the prices of raw food materials (-3.7%), while prices of industrial raw materials dipped by -1.2%.
In October, the crude oil price in euros fell (-4.0%), reaching € 80.2 per barrel of Brent. The euro prices of commodities except energy imported into France also decreased (-2.2%), essentially due to the decline of the prices of raw food materials (-3.7%), while prices of industrial raw materials dipped by -1.2%.
The price of crude oil declined
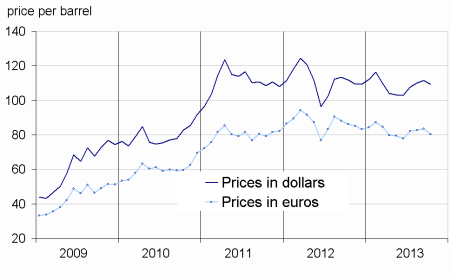
In October, the price of crude oil from the North Sea (Brent) in dollars slid (-2.0% after +1.3%), due to geopolitical tensions that showed signs of abating in the Middle East. It stood at $109.4 per barrel on average. In euro terms, the decrease is more substantial (-4.0% after +1.0% ), due to an appreciation of the euro against the dollar (+2.2%).
The prices of imported industrial raw materials dropped
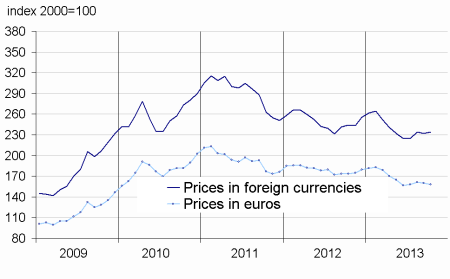
In October, the prices of industrial raw materials in euros declined (-1.2% after -1.0% in September).The prices of mineral raw materials still decreased (-1.4% after –2.1%) in non-ferrous metals as well as in iron ore (-4.4% from -0.1% and -3.3% from -2.4% respectively). This was particularly the case of gold prices (–4.5% after -0.2%), silver (–4.9% after +3.0%) and platinum (–5.0% after -2.8%). The fall in non-ferrous metals eased (-0.5% after -2.3%). The prices of agro-industrial raw materials dropped as well (–0.6% after +2.4%) In particular, those of natural rubber slumped (–5.3% after +2.4%), reviving the downward trend observed since the beginning of 2013 and linked with the supply rise in Asia (Malaysia, Thailand).
Drop in raw food materials prices
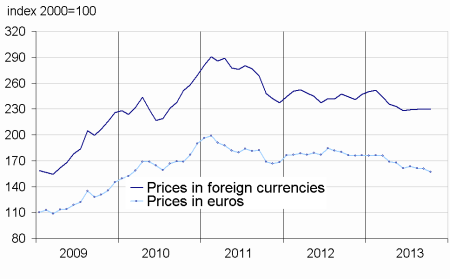
In October, the prices of raw food materials in euros dipped sharply (-3.7%) following a slight increase in September (+1.0%). This decline was attributable to a fall in international cereal prices (-6.3% after -6.0% in September) and oilseeds (-8.8% after +4.2%), due to higher-than-expected soya stocks. The prices of sugar rose sharply (+8.0% after +1.8%) because of bad weather conditions in Brazil, the world’s first exporter and producer.The prices of tropical foodstuffs declined slightly (-0.2% after +1.1%). The prices of Arabica (-3.5%) and of Robusta (-5.7%) slipped again, due to a rise in supply from Brazil for Arabica, and from Vietnam for Robusta. This fall was offset by the cocoa price rise (+2.6%).
tableautabpetrole – Oil and petroleum products
| Prices | Change (%) | |||
|---|---|---|---|---|
| of last month | over the last month | over the last 3 months | over the last 12 months | |
| Brent in $ per barrel | 109,4 | –2,0 | 1,6 | –2,2 |
| Brent in € per barrel | 80,2 | –4,0 | –2,6 | –7,0 |
| Gasoline €/L | 0,48 | –8,0 | –17,6 | –19,9 |
| Gas Oil | 680,4 | –3,1 | –2,3 | –10,3 |
| Heavy fuel | 440,4 | –4,1 | –4,8 | –11,7 |
| Naphtha | 661,9 | –4,8 | –1,3 | –10,1 |
- Prices are in euros per tonne unless otherwise specified
- Source : INSEE
tableautabmatprem_ang – Imported raw materials (excluding energy) in euros
| Index | Changes (%) | |||
|---|---|---|---|---|
| over the last month | over the last 3 months | over the last 12 months | ||
| Food total | 173,1 | –3,7 | –9,4 | –13,8 |
| Tropical foodstuffs | 144,2 | –0,2 | 1,6 | –11,9 |
| Oil seeds, vegetable oils | 220,6 | –8,8 | –16,8 | –15,9 |
| Cereals | 149,2 | –6,3 | –22,5 | –33,2 |
| Sugar | 154,4 | 8,0 | 10,1 | –12,3 |
| Beef meat | 114,9 | 1,8 | –3,5 | –1,6 |
| Industrial raw materials | 158,0 | –1,2 | –0,1 | –9,0 |
| Agricultural raw materials | 104,7 | –0,6 | 2,2 | 0,8 |
| Natural Fibers | 124,2 | –2,5 | –5,9 | 3,1 |
| Natural rubber | 244,4 | –5,3 | 1,5 | –24,3 |
| Hides | 79,5 | 1,0 | –8,9 | 2,9 |
| Wood pulp | 87,5 | –0,4 | –1,8 | 4,0 |
| Tropical wood | 98,3 | –0,8 | 1,6 | –4,5 |
| Sawn softwood | 95,4 | 1,7 | 10,6 | 15,0 |
| Minerals | 187,1 | –1,4 | –0,9 | –11,9 |
| Iron ore | 719,3 | –3,3 | –0,1 | 10,6 |
| Non-ferrous metals | 140,4 | –0,5 | –1,2 | –14,8 |
| Precious metals | 229,5 | –4,4 | 0,0 | –27,8 |
| All commodities | 157,2 | –2,2 | –3,8 | –10,8 |
- Source : INSEE
graphiqueG_petrole_ang – Oil
- Source : Insee
graphiqueG_alim_ang – Food
- Source : Insee
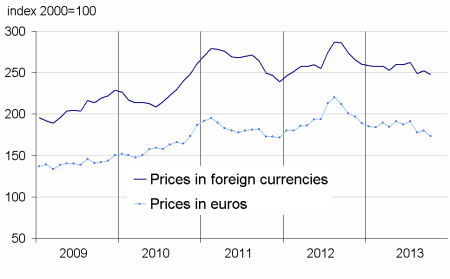
graphiqueG_ensemble_ang – All commodities
- Source : Insee
graphiqueG_indus_ang – Industrial raw materials
- Source : Insee
Pour en savoir plus
Time series : Raw materials prices