


 31 July 2013
2013- n° 183Overall producer prices of agricultural products decreased in June Indices of agricultural prices - June 2013
31 July 2013
2013- n° 183Overall producer prices of agricultural products decreased in June Indices of agricultural prices - June 2013
In June 2013, overall producer prices of agricultural products decreased by 1.5 % ; over one year they rose by 6.2 %.
In June 2013, overall producer prices of agricultural products decreased by 1.5 % ; over one year they rose by 6.2 %.
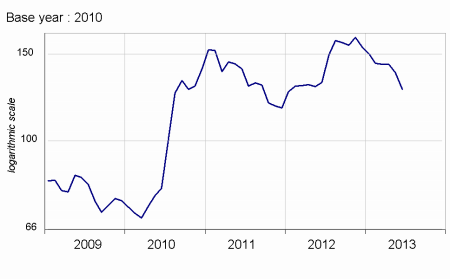
Cereal prices noticeably decreased in June (–7.5%). Abundant crops of wheat were forecast in the Northern hemisphere and its prices tumbled. Maïze prices slightly recovered despite upward prediction of global production ; french maïze sold well, as a result of the demand coming both from french manufacturers of animal feed and these from North-Europe.
graphiquecereal – Production prices of cereals
Oleaginous prices decreased in June (-1.7 %). The good conditions of growing allowed to foresee an abundant crop.
Potatoes prices more than doubled in June compared to the same month last year (+139.9 %), due to a marked shortfall of supply in North-Western Europe.
Wine prices dropped in June (-0.6 %) but jumped over one year (10.7 %). The prices for some PDO wines were sustained by the export demand. The less significant crop last autumn led to a rise in prices for other wines.
Fresh fruits prices increased year-over-year (+14.8 %). Apricots and peaches prices rose : bad weather conditions and a diminishing planted area (mainly for peaches) led to decreasing supplies. On the other hand, cherries decreased : consumers little consumed this fruit with regard to the dull weather in June.
graphiquevegetable – Production prices of fresh vegetables
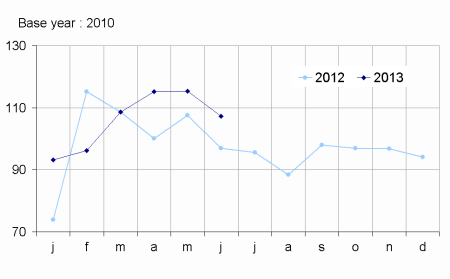
Fresh vegetables prices rose year-over-year (+10.6 %). On the supply side, the lack of sun and cool temperatures during June led to a deficit of production for most seasonal vegetables, and their prices increased. On the demand side, the dull weather affected tomatoes consumption whose price slumped despite a decreasing production as well. Conversely, the consumers fell back on leeks, a vegetable which is rather consumed during the cold season.
graphiquepig – Production prices of pigs and big cattle
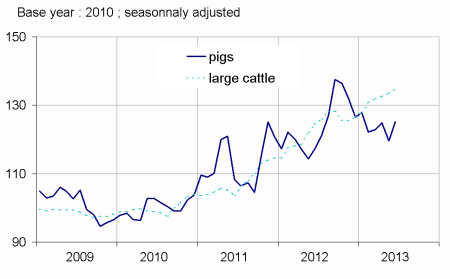
On a seasonally adjusted basis, animals prices increased in June (+1.6 %). Pigs were more expensive due to a reduced European supply this month. Big cattle prices remainded stable further to a lower availability of these beasts. Eggs prices plummeted over one year (-34.7 %) as a consequence of the recovery of the production capacities
tableauTab1 – Indices of producer prices of agricultural products (IPPAP)
| Variation as % over | |||||
|---|---|---|---|---|---|
| weights | June 2013 | a month | 3 month | a year | |
| raw | Seasonally adjusted data | raw | |||
| Agricultural goods output | 1000 | 121.8 | –1.5 | –2.1 | +6.2 |
| excluding fruits and vegetables | 900 | 122.7 | –1.3 | –1.5 | +5.7 |
| Crop output (excluding fruits and vegetables) | 502 | 125.4 | –3.0 | –3.9 | +7.2 |
| Cereals | 190 | 127.2 | –7.5 | –11.2 | –3.2 |
| of which soft wheat | 113 | 122.4 | –12.1 | –15.3 | –6.3 |
| grain maize | 42 | 133.7 | +1.5 | –2.5 | +6.7 |
| Potatoes | 26 | 226.9 | /// | /// | +139.9 |
| Wines | 171 | 117.5 | –0.6 | +0.3 | +10.7 |
| Protected designation of origine | 135 | 115.8 | –1.1 | +0.2 | +9.5 |
| other wines | 36 | 123.8 | +1.1 | +0.7 | +14.8 |
| Oleaginous | 49 | 121.1 | –1.7 | –6.2 | –4.9 |
| Horticultural products | 31 | 102.5 | –2.2 | –4.8 | +2.2 |
| Other crop products | 34 | 112.1 | +0.1 | –2.8 | +2.8 |
| Fruits and vegetables (1) | 100 | 112.8 | /// | /// | +11.3 |
| Fresh vegetables | 93 | 107.2 | /// | /// | +10.6 |
| Fresh fruits | 41 | 122.2 | /// | /// | +14.8 |
| Animal output | 398 | 119.3 | +1.0 | +2.0 | +3.8 |
| Animals | 234 | 126.3 | +1.6 | +1.1 | +7.3 |
| of which large cattle | 96 | 133.6 | +1.7 | +2.3 | +8.1 |
| calves | 26 | 107.8 | –2.1 | –5.9 | +0.5 |
| pigs | 54 | 129.1 | +4.7 | +1.9 | +6.7 |
| sheep | 10 | 113.0 | +1.4 | +10.1 | +12.3 |
| poultry | 44 | 123.2 | –0.3 | –0.2 | +9.2 |
| of which chicken | 18 | 125.4 | –0.2 | +0.1 | +10.9 |
| Milk | 149 | 110.7 | 0.0 | +5.5 | +3.2 |
| of which cow milk (2) | 139 | 111.8 | 0.0 | +5.9 | +3.2 |
| Eggs | 15 | 95.8 | –0.6 | –16.3 | –34.7 |
- (1) Including vegetables for industry.
- (2) The price for June is not yet known and therefore is estimated by carrying forward the seasonally adjusted price from May
- Sources: INSEE - SSP (Ministry of Agriculture)
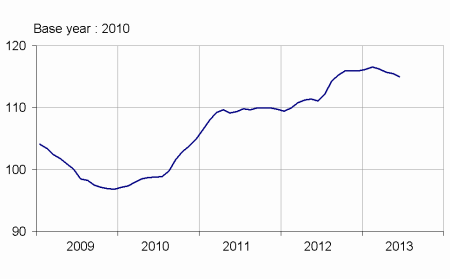
Purchase prices of the means of agricultural production decreased in June.
Prices of intermediate consumptions dipped in June (–0.6 %), while these of investment stagnated. Prices of feed for animals roughly surged by 10 % over one year.
graphiquemeans – Purchase prices of the means of agricultural production
tableauTab2 – Indices of purchase prices of the means of agricultural production (IPAMPA)
| weights | June 2013 | Variation as % over | |||
|---|---|---|---|---|---|
| a month | 3 month | a year | |||
| Total input | 1000 | 115.2 | –0.5 | –1.1 | +3.6 |
| Intermediate consumptions | 755 | 118.3 | –0.6 | –1.4 | +4.2 |
| Energy (1) | 102 | 117.1 | 0.0 | –3.5 | +2.0 |
| Seeds | 67 | 108.7 | +0.2 | +0.4 | +4.6 |
| Fertilisers and soil improvers | 100 | 124.2 | –3.6 | –4.4 | –2.6 |
| Plant protection products | 83 | 101.1 | –0.1 | +0.9 | +0.9 |
| Animal feed | 211 | 135.4 | –0.4 | –1.7 | +10.8 |
| Veterinary expenses | 50 | 108.6 | +0.1 | +0.8 | +2.7 |
| Small equipment and tools | 16 | 108.9 | +0.4 | +0.8 | +2.4 |
| Maintenance of materials | 73 | 108.6 | +0.2 | +0.5 | +2.9 |
| Maintenance of buildings | 9 | 107.0 | 0.0 | 0.0 | +1.2 |
| Other goods and services | 52 | 105.9 | 0.0 | +0.4 | +2.0 |
| Goods and services contributing to investment | 245 | 105.7 | 0.0 | –0.2 | +1.8 |
| Material | 193 | 105.1 | 0.0 | –0.3 | +2.2 |
| Tractors | 82 | 105.5 | 0.0 | –0.7 | +1.9 |
| Machinery and plant for cultivation | 37 | 104.4 | 0.0 | –0.5 | +2.8 |
| Machinery and plant for harvesting | 43 | 105.8 | 0.0 | +0.3 | +2.8 |
| Utility vehicles | 19 | 102.5 | 0.0 | +0.1 | 0.0 |
| Buildings | 52 | 108.0 | 0.0 | 0.0 | +0.5 |
- (1) The repayment of the domestic tax on energy products (TICPE) benefiting farmers has been applied in advance for the year 2013
- Sources: INSEE - SSP (Ministry of Agriculture)
Documentation
Methodology (pdf,122 Ko)
Pour en savoir plus
Time series : Indices of agricultural prices
