

 17 October 2013
2013- n° 239In September 2013, the price of crude oil climbed Prices of oil and raw material imports - September 2013
17 October 2013
2013- n° 239In September 2013, the price of crude oil climbed Prices of oil and raw material imports - September 2013
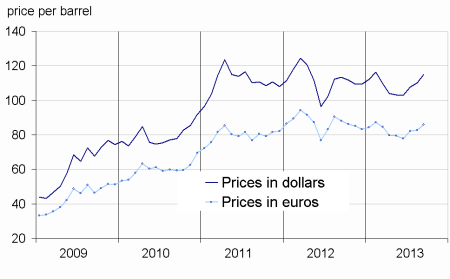
In September, the crude oil price in euros increased more sharply than in August (+4.0% from +0.5%), reaching € 86.0 on average per barrel of Brent. The prices in euros of imported raw materials excluding energy declined slightly
In September, the crude oil price in euros increased more sharply than in August (+4.0% from +0.5%), reaching € 86.0 on average per barrel of Brent. The prices in euros of imported raw materials excluding energy declined slightly
(-0.3% after -1.5%). The prices of raw food materials recovered moderately on last month (+1.0% after -6.8%). The prices of industrial raw materials dropped by 1% (after +2.1%).
The price of crude oil rose
In dollar terms, the price of crude oil from the North Sea (Brent) continued to climb (+4.3% after +2.3%) and stood at $114.9 per barrel. In euro terms, this increase was also significant (+4.0% after +0.5%), due to a lower appreciation of the euro against the dollar (+0.3%).
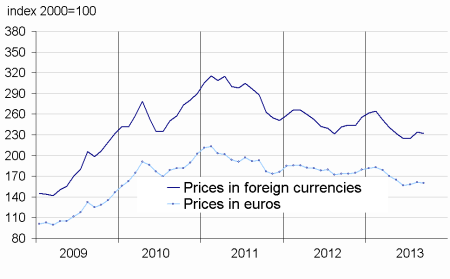
Decrease in prices of imported industrial raw materials
In euro terms, the prices of industrial raw materials dipped slightly (-1.0% after +2.1% in August). In particuliar, the prices of mineral raw materials slipped, compared to August
(-2.1% after +2.7%) : titanium excepted (+0.8%), the prices of all the non-ferrous and precious metals decreased. The copper price dropped (-0.6% from +2.4%) because the Chinese demand was weaker, due to the level of final goods inventories. The prices of lead (-4.2%) and of zinc (–3.0%) dropped sharply. The price of iron ore declined as well, due to an increase in the worldwide production. The prices of precious metals went down too (–0.1% after +4.7%). The platinum prices (-2.8% after +4.7%) and the palladium (–4.7% after +1.2 %) were the main vectors of the decrease. The gold price decrease (-0.2% after +2.9%) was due to the weakening of the geopolitical tension in the Middle East. The prices of agro-industrial raw materials rose (+2.4% after +0.4%), the decrease in natural fibres (-2.0%) was compensated by the natural rubber price increase (+2.4%) and the sawn softwood one (+6.0%).
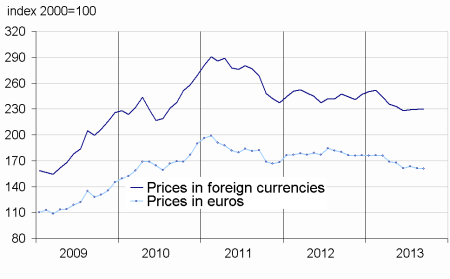
The prices of raw food materials recovered slightly
The prices of raw food materials rose (+1.0% from -6.8% in August). The prices of oil seeds went up, compared to August, in particuliar the sunflower ones (+0.2 % after –17.7%) and the soya meal (+7.7% after -16.2%), as a result of lower crop anticipations due to bad weather conditions in the United States. On the other hand, the cereal prices still bottomed out (-6.0% after -12.1%).
tableautabpetrole – Oil and petroleum products
| Prices | Change (%) | |||
|---|---|---|---|---|
| of last month | over the last month | over the last 3 months | over the last 12 months | |
| Brent in $ per barrel | 114,9 | 4,3 | 11,7 | 1,4 |
| Brent in € per barrel | 86,0 | 4,0 | 10,4 | –2,3 |
| Gasoline €/L | 0,556 | –4,1 | 1,1 | –17,1 |
| Gas Oil | 719,3 | 2,6 | 8,7 | –6,1 |
| Heavy fuel | 459,4 | 0,2 | –0,1 | –15,6 |
| Naphtha | 716,1 | 5,0 | 11,8 | –4,7 |
- Prices are in euros per tonne unless otherwise specified
- Source : Insee
tableautabmatprem – Imported raw materials (excluding energy) in euros
| Index | Changes (%) | |||
|---|---|---|---|---|
| over the last month | over the last 3 months | over the last 12 months | ||
| Food total | 179,8 | 1,0 | –4,0 | –15,1 |
| Tropical foodstuffs | 144,5 | 1,1 | 4,0 | –16,4 |
| Oil seeds, vegetable oils | 241,9 | 4,2 | –5,0 | –14,8 |
| Cereals | 159,2 | –6,0 | –20,9 | –30,1 |
| Sugar | 142,9 | 1,8 | 1,5 | –15,6 |
| Beef meat | 112,8 | –3,2 | –5,0 | –5,4 |
| Industrial raw materials | 159,9 | –1,0 | 2,0 | –7,8 |
| Agricultural raw materials | 105,3 | 2,4 | 4,4 | 2,8 |
| Natural Fibers | 127,1 | –2,0 | –4,1 | 3,0 |
| Natural rubber | 258,1 | 2,4 | 3,8 | –14,5 |
| Hides | 78,7 | –4,4 | –8,7 | 2,3 |
| Wood pulp | 87,9 | 0,5 | –0,5 | 5,2 |
| Tropical wood | 99,0 | 2,1 | 1,2 | –5,1 |
| Sawn softwood | 93,8 | 6,0 | 15,2 | 12,8 |
| Minerals | 189,7 | –2,1 | 1,2 | –11,0 |
| Iron ore | 743,8 | –2,4 | 15,4 | 30,0 |
| Non-ferrous metals | 141,0 | –2,3 | –2,4 | –16,9 |
| Precious metals | 240,1 | –0,1 | 1,2 | –25,4 |
| All commodities | 160,6 | –0,3 | –0,4 | –10,7 |
- Source : Insee
graphiqueG_petrole_ang – Oil
- Source : Insee
graphiqueG_alim_ang – Food
- Source : Insee
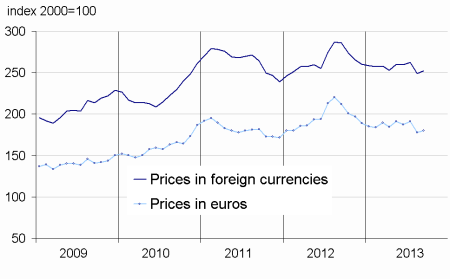
graphiqueG_ensemble_ang – All commodities
- Source : Insee
graphiqueG_indus_ang – Industrial raw materials
- Source : Insee
Pour en savoir plus
Time series : Raw materials prices