

 14 February 2014
2014- n° 37In January 2014, oil prices decreased Prices of oil and raw material imports - January 2014
14 February 2014
2014- n° 37In January 2014, oil prices decreased Prices of oil and raw material imports - January 2014
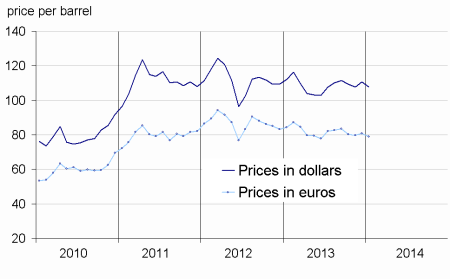
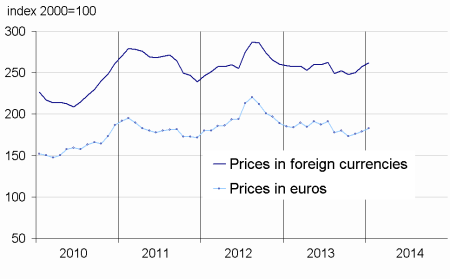
In January, the price of crude oil in euro terms decreased (–2.2%) at €79.0 per barrel of Brent. Prices of imported commodities except energy in euros went up slightly (+1.1%), due to a rise in food materials prices (+2.3%).
In January, the price of crude oil in euro terms decreased (–2.2%) at €79.0 per barrel of Brent. Prices of imported commodities except energy in euros went up slightly (+1.1%), due to a rise in food materials prices (+2.3%).
Oil prices in euros declined
In January, the price of crude oil from the North Sea (Brent) in dollars went down (-2.8% after +2.8%), thanks to a release of geopolitical tensions in the Middle East, where production has gained some momentum - especially in Libya. Thus, the price of Brent has come back to its November 2013 level ($107.7). In euros, the drop in the Brent price was less marked (-2.2% from +1.1%) due to a slight depreciation of the euro against the dollar (-0.6%).
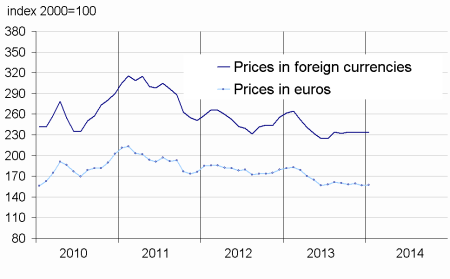
Slight hike in industrial raw materials prices
In January, prices of industrial raw materials in euros came up slightly (+0.3% after -1.5% in December). Mineral raw materials prices increased slightly (+0.2% after –1.2%). Those of precious metals in particular rose (+3.0% from –5.9%) including platinum (-5.7% after –1.5%), whose price was dragged up by strikes in the South African mines. Platinum prices also rose (+3.4% after -4.1%) : the global motor industry was dynamic, and the supply from Russia has shrunk again. Prices of non-ferrous metals bumped as well (+1.5% after -0.5%), especially those of titanium (+5.0% after -0.6%). Prices of iron ore, on the contrary, declined (–5.1% after -2.0%).
Prices of agricultural raw materials went up slightly (-+0.7% after -2.3%) led by a hike in wood pulp prices (+1.2% from –0.5%). This hike was partly offset by a drop in natural rubber prices (-5.1% after -2.0%), due to an oversupplied market.
Slight rise in raw food materials prices
In January, prices of raw food materials in euros increased (+2.3% after +1.4%). The price of beef meat rallied (+17.5% after -1.1%), due to bad weather conditions in the United-States that caused the market to be undersupplied. Arabica prices went up again (+5.7% after +4.3%), due to disappointing crops in Brazil, the first global producer. These hikes were offset by a drop in oil seeds prices (-2.6% after +3.3%).
tableautabpetrole – Oil and petroleum products
| Prices | Change (%) | |||
|---|---|---|---|---|
| of last month | over the last month | over the last 3 months | over the last 12 months | |
| Brent in $ per barrel | 107,6 | –2,8 | –1,6 | –4,0 |
| Brent in € per barrel | 79,0 | –2,2 | –1,5 | –6,3 |
| Gasoline €/L | 0,49 | 3,0 | 1,7 | –13,2 |
| Gas Oil | 671,0 | –2,0 | –1,4 | –6,9 |
| Heavy fuel | 433,9 | –2,1 | –1,5 | –9,3 |
| Naphtha | 681,7 | –2,2 | 2,9 | –2,8 |
- Prices are in euros per tonne unless otherwise specified
- Source : INSEE
tableautabmatprem – Imported raw materials (excluding energy) in euros
| Index | Changes (%) | |||
|---|---|---|---|---|
| over the last month | over the last 3 months | over the last 12 months | ||
| Food total | 182,9 | 2,3 | 5,7 | –1,1 |
| Tropical foodstuff | 149,0 | 0,5 | 3,3 | 0,6 |
| Oil seeds, vegetable oils | 229,7 | –2,6 | 4,2 | –2,2 |
| Cereals | 145,3 | –0,4 | –2,6 | –31,3 |
| Sugar | 126,7 | –5,5 | –18,0 | –19,5 |
| Beef meat | 137,6 | 17,5 | 19,8 | 18,2 |
| Industrial raw materials | 157,5 | 0,3 | –0,4 | –13,4 |
| Agricultural raw materials | 106,7 | 0,7 | 1,9 | –4,0 |
| Natural Fibers | 125,7 | 3,9 | 1,2 | 1,4 |
| Natural rubber | 225,4 | –6,2 | –7,8 | –30,6 |
| Hides | 88,3 | 0,0 | 11,2 | 8,1 |
| Wood pulp | 90,7 | 1,2 | 3,6 | 7,4 |
| Tropical wood | 100,8 | 1,2 | 2,5 | 0,7 |
| Sawn softwood | 99,0 | 3,1 | 3,8 | –4,7 |
| Minerals | 184,9 | 0,2 | –1,1 | –16,2 |
| Iron ore | 696,2 | –5,1 | –3,2 | –16,9 |
| Non-ferrous metals | 140,2 | 1,5 | –0,1 | –14,7 |
| Precious metals | 218,7 | 3,0 | –4,7 | –27,0 |
| All commodities | 160,2 | 1,1 | 1,9 | –9,0 |
- Source : INSEE
graphiqueG_petrole_ang – Oil
- Source : Insee
graphiqueG_alim_ang – Food
- Source : Insee
graphiqueG_ensemble_ang – All commodities

- Source : Insee
graphiqueG_indus_ang – Industrial raw materials
- Source : Insee
Pour en savoir plus
Time series : Raw materials prices