

 Quality of life and well-being often go hand in hand
Adults living in Metropolitan France in 2011 gave themselves an average life satisfaction score of 6.8 on a scale of 0 to 10. Although 13 % of them evaluated their well-being at 9 or 10, only 7 % gave themselves 5 or less on the satisfaction scale. It is not only monetary and financial constraints or low incomes that explain the low level of satisfaction. A groundbreaking survey has shown that other aspects of quality of life, such as weak social ties or stress in everyday life, play as much or even a greater role than financial constraints ; followed by difficulties in health, housing and physical and economic insecurity. Poor environmental conditions does not seem to have an effect on perceived well-being, nor do the perceived tensions within society. On the other hand, people having psycho-social risks in work are those who more frequently report a lower global life satisfaction.
- On a scale of 0 to 10, adults rate their well-being at an average of 6.8
- Social isolation, financial constraints and stress are synonymous with lesser well-being
- Psychosocial risks at work go hand in hand with lesser well-being among working people
- Box 1 - Well-being and quality of life
- Box 2 - Mechanical effects or causality ?
- Box 3 - Quality of life indicators
On a scale of 0 to 10, adults rate their well-being at an average of 6.8
Numerous initiatives have sprung up in France since the report on the measurement of economic and social progress (Stiglitz report). One of them is a specific survey set up in 2011 in order to gain an insight into some of the quality of-life aspects that were highlighted by the report but rarely addressed in France. In this survey adults living in Metropolitan France appraised their own feeling of well-being, i.e. their degree of satisfaction in life, measured on a scale of 0 to 10. The average rating was 6.8 (boxes 1 and 2).
There are few dissatisfied people in the population : only 7 % gave a score lower than 5 to rate their level of satisfaction in life (graph). Such a low level of satisfaction was expressed by inhabitants of the Paris conurbation and by adults living either alone or only with minors, with respectively 9.8 % and 10.8 %. But above all it is expressed by 22.5 % of people in the first decile of fiscal income.
Conversely, those who are satisfied with their life − people giving a score of over 8 − account for almost double the number, with 13 % of the adult population. Proportionally, slightly more of these people (15.5 %) feature among the age bracket of 65 or over. But once again it is income that seems to play the most significant role, with 23.4 % of satisfied people among those belonging to a high-income household (in the last decile).
graphiqueGraph – Overall life-satisfaction
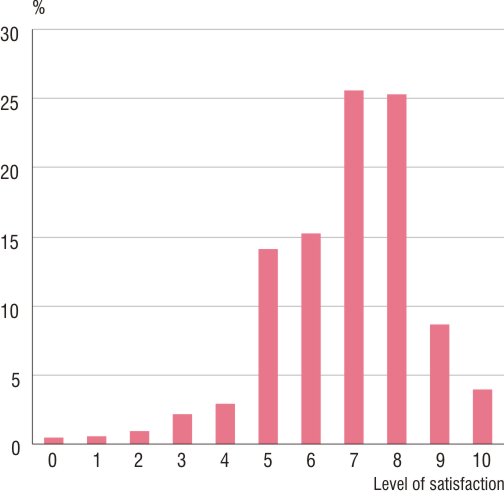
- How to read this chart: To the question “on a scale of 0 (not at all satisfied) to 10 (very satisfied), rate your satisfaction with your life at the present time” a quater of respondents gave themselves a score of 8.
- Scope of coverage: metropolitan France, persons aged 18+ living in private households.
- Source : Insee, quality of life survey, 2011.
Social isolation, financial constraints and stress are synonymous with lesser well-being
In order to gain a better understanding of the subjective notion of perceived well-being, this survey studies its links with quality-of-life determinants which are generally described as objective (health, education, family situation, etc.) (box 3). This research concurs with studies currently being conducted in a number of countries by the OECD, which have established that income aside, it is the state of health, the fact of not being unemployed, and social relations which are particularly important quality-of-life indicators that explain divergences in perceived well-being.
The survey conducted in France has served to clarify the significant apparent effect of income. While it highlights the strong influence of monetary constraints on differences in well-being, it also shows that divergences in well-being are not only about differences in resources. Taking into account the various quality- of-life dimensions recommended by the Stiglitz report, it is observed that other aspects of quality of life such as weak social links or stress in day-to-day life influence the degree of satisfaction as much as or even more than insufficient financial resources (table 1). Poor health, poor housing conditions, and feelings of physical or economic insecurity also coincide with lower levels of satisfaction. However, the perception of environmental quality or of tensions in society does not have a significant influence on perceived well-being.
These dimensions of quality of life do not affect the degree of satisfaction in the same way : their influences on a high level of well-being and a low level of well-being are not necessarily symmetrical. For example, weak social links are the dimension most closely associated with the risk of being very dissatisfied (0 to 4 on the scale), followed by financial difficulties, poor housing conditions, poor health, and stress in daily life. But at the other end of the scale, it is this latter aspect which most significantly reduces the chances of declaring a high level of well-being (9 and 10 on the scale), ahead of social isolation and poor health.
tableauTable 1 – Factors determining perceived well-being for general population
| Quality of life indicators | Perceived Well-Being | Low perceivedWell-Being 1 | Strong perceivedWell-Being | Socio-demographic profiles | Perceived Well-Being | Low perceived Well-Being 1 | Strong perceived Well-Being 2 |
|---|---|---|---|---|---|---|---|
| Living conditions | |||||||
| Poor housing conditions | - | + | Age group (years) | ||||
| Financial constraints | -- | + | 18-24 | ||||
| Health | 25-44 | ||||||
| Poor physical health | - | + | - | 45-64 | |||
| Decreased emotional well-being | -- | + | -- | 65-74 | + | + | |
| Weak social connections | -- | ++ | - | 75 + | + | + | |
| Insecurity (economic and physical) | - | Level of education | |||||
| Income per consumption unit | No diploma | ||||||
| 1st decile | - | + | CEP | - | |||
| 2nd decile | Brevet | - | |||||
| 3rd decile | CAP | ||||||
| 4th decile | Baccalaureate | ||||||
| 5th decile | Higher education | + | |||||
| 6th decile | Household make-up | ||||||
| 7th decile | Lone adult | ||||||
| 8th decile | One adult with minor(s) | ||||||
| 9th decile | + | Several adults without minors | + | + | |||
| 10th decile | + | + | Several adults with minor(s) | + | + |
- 1. Life satisfaction under 5 on a scale of 0 to 10.
- 2. Life satisfaction above 8 on a scale from 0 to 10.
- How to read this table: For general population, poor physical health has a negative effect on an individual’s well-being and his chances of achieving the upper level of satisfaction. Indicators of poor environment and lack of trust in society are not mentioned in this table but are taken into account in the model. Similarly, the variable "sex", "place of born" and "size of settlement" are not mentioned in the table but are also taken into account in the model.
- Scope of coverage: metropolitan France, persons aged 18+ living in private households
- Source : Insee, quality of life survey, 2011.
Psychosocial risks at work go hand in hand with lesser well-being among working people
For the first time in France, the survey also addressed the question of psychosocial risks at work. For working people, this means taking account of a further dimension relating to their quality of life at work. In this respect psychosocial risks at work bring with them a lesser feeling of well-being, and it seems that unhappiness at work does not replace emotional unhappiness in daily life, but instead adds to it. The impact of psychosocial risks at work appears to be comparable to that of health problems, but not as strong as financial constraints, social isolation, or stress in daily life. Additionally, the well-being of people who have a job is more dependent on financial constraints than among the population as a whole : the existence of such constraints reduces the likelihood of working people stating that they have a high degree of well-being (table 2).
However, while for the population as a whole, with given quality of life indicators, the fact of being among the wealthiest (last income per consumption unit decile) increases the likelihood of declaring a high level of well-being, this is no longer the case when restricted to people who have a job.
tableauTable 2 – Factors determining perceived well-being, classed according to the quality of life indicators and socio-demographic profiles of respondents
| Perceived Well-Being | Low perceived Well-Being1 | Strong perceived Well-Being2 | |
|---|---|---|---|
| Living conditions | |||
| Poor housing conditions | - | + | |
| Financial constraints | -- | + | -- |
| Health | |||
| Poor physical health | - | + | - |
| Decreased emotional well-being | -- | + | -- |
| Weak social connections | -- | ++ | |
| Insecurity (economic and physical) | |||
| Psycho-social risks in work | - | ++ | - |
| Income per consumption unit | |||
| 1st decile | |||
| 2nd decile | |||
| 3rd decile | |||
| 4th decile | |||
| 5th decile | |||
| 6th decile | |||
| 7th decile | |||
| 8th decile | + | ||
| 9th decile | + | ||
| 10th decile | |||
| Household make-up | |||
| Lone adult | |||
| One adult with minor(s) | |||
| Several adults without minors | + | + | |
| Several adults with minor(s) | + | + |
- 1. Life satisfaction under 5 on a scale of 0 to 10.
- 2. Life satisfaction under 8 on a scale of 0 to 10.
- How to read this table: For people in active employment, poor physical health has a negative effect on an individual’s well-being and his chances of achieving the upper level of satisfaction.
- and his chances of achieving the upper level of satisfaction, that is to say a stong perceived well-being.
- Indicators of poor environment and lack of trust in society are not mentioned in this table but are taken into account in the model
- Similarly, the variable "sex", "place of born" and "size of settlement" are not mentioned in the table but are also taken into account in the model.
- Scope of coverage: metropolitan France, persons aged 18+ living in private households.
- Source : Insee, quality of life survey, 2011.
Box 1 - Well-being and quality of life
The Report on the Measurement of Economic and Social Progress, drafted by the Commission chaired by Professor Stiglitz, recommends, among other things, improving the measurement of quality of life by not focussing too exclusively on a single indicator, particularly Gross Domestic Product (GDP). Following of the report, a number of national and international initiatives have emerged with the aim of proposing indicators to better measure quality of life. Among the many initiatives taken in France, a specific survey on quality of life was conducted by INSEE in 2011 to simultaneously consider most of the dimensions of quality of life identified in the report (sources).
Box 2 - Mechanical effects or causality ?
The survey at our disposal was conducted in a single year using different subjects, but does not follow these subjects over multiple years as they pass through different stages in their lives. The links we observe may just as well be the effect of a specific cause, rather than expressing the heterogeneity between individuals. A causal effect means that a given person suddenly experiencing social isolation will experience a reduction in perceived well-being. At any given moment, if all individuals were identical, we would observe nothing but the effects of specific causes. But if we accept that people can be different, these differences can have a simultaneous impact on quality of life variables and on perceived well-being. Thus, a person of inherently morose disposition will have social relationships which are weakened by his chronic lack of enthusiasm, but will also have a pessimistic outlook which will affect his perceived well-being, without the latter is explained by weak social connections.
The most effective way of addressing these questions of heterogeneity between individuals is to follow people over time, in order to see whether, for a given individual, sudden isolation really translates into a reduction in their well-being. We have recently gained access to quality of life and perceived well-being data which covers two years, established with the French version of the EU-SILC panell. Initial investigations seem to suggest that, for those quality of life variables which are common to the panell and the survey used here, the links observed are indeed causal links, although their effects are slightly reduced.
Box 3 - Quality of life indicators
In addition to perceived well-being, the quality of life factors selected by the Stiglitz report are as follows : material living conditions, health, education, productive activity, governance and individual rights, leisure activities and social contacts, environment and living conditions, and economic and physical security. As academic titles are a fairly poor indicator of level of education in the sense intended by the report, for the purposes of this analysis, academic qualifications were considered as a classical socio-demographic variable on a par with income, age, gender, for example.
The variables used for indicators of quality of life are as follows :
· Material living conditions
− poor housing conditions : lack of space, damp, lack of outdoor space,
− financial constraints : insufficient means to heat or cool the home, take holidays, replace furniture, buy meat, buy new clothes, invite guests to the home, run a car, difficulties paying rent etc., difficulties paying for medical treatment, forced to leave home ;
· Health
− poor physical health : perceived state of health, chronic illnesses, health problems afflicting daily life,
− poor emotional well being (stress in daily life) : not in a good mood, lack of energy and motivation, not calm and relaxed, not fresh and rested when waked up ;
· Psychosocial risks relating to work (poor well being at work) : stressed, underpaid, lacking independence, witnessing things you disapprove, not having the satisfaction of a job well done, working to tight deadlines, working in dangerous conditions, too tired to perform household tasks, difficulty fulfilling family obligations, difficulty concentrating at work ;
· Lack of trust in society (governance and individual rights) : distrust of others, tension between rich and poor, tension between bosses and workers, tension between men and women, tension between young and old, tension between ethnic groups, tension between religious groups, lack of faith in the law, the press, the police, experts, public officials ;
· Weak social connections : unsatisfied with family life, not in contact with family members, lack of conversation, lack of trust in others ;
· Poor environmental conditions : poor water quality, noise, air pollution, lack of green spaces, dirty surroundings ;
· Economic and physical insecurity : crime rates in the area, unemployment, risk of losing job.
Sources
The quality of life survey conducted by INSEE in May 2011 has resulted in an examination - for the first time - of most of the quality of life indicators defined in the Stiglitz, Sen, Fitoussi report (bibliography).
10,000 people aged 18 or over were contacted by mail and asked to respond to an online questionnaire. Where necessary they received a reminder by post with a paper questionnaire to return by post. No questions were asked about family links within the dwelling. The "demographic composition of the household" variable describes the number of adults and minors living in the dwelling as defined by the tax authorities. In particular, it is not known whether two unmarried adults (or living in civil union) who cohabit in the same dwelling form a de facto couple.
The people surveyed were not asked about their income : this data corresponds to the income declared to the tax authorities, i.e. income that does not include non-taxable benefits (family allowances, etc.). The income used here represents the total fiscal income of the persons in the dwelling, related to the number of consumption units that they comprise (definitions).
In 2011, France Portrait Social presented a study on an analogous theme using the French version of EU-SILC (European Survey on Income and Living Conditions) of 2010 (bibliography). The survey used here provides indications on a broader range of quality of life indicators than the EU-SILC, in particular the quality of social links, emotional well-being, insecurities, psychosocial risks at work, the environment, and the perceived quality of society. However, the EU-SILC had a larger sample. While the point is not to interpret the difference in average satisfaction level between the study presented here and that of France Portrait Social 2011, there are numerous similarities in terms of results :
− material living conditions and health issues respectively have a very negative and a negative influence on well-being ;
− the same is true of other indicators that were partially included in the EU-SILC : unemployed status (component of insecurity), and working conditions (similar to psychosocial risks) ;
− once the quality of life indicators have been taken into account, the positive role played by income fades, although it does remain at the two ends of the resources scale ;
− the role played by age is very sensitive to specification and the contrasts between age groups differ according to this specification ;
− lastly, average well-being increases with qualifications in both sources. However, depending on the quality of life variables and other socio-demographic variables, and irrespective of specification variants, a high level of qualification has a positive influence on well-being in the quality of life survey whereas it plays a negative role in the EU-SILC. This point of divergence can perhaps be ascribed to the way the data were collected, and will have to be closely addressed in forthcoming studies.
Définitions
Income per consumption unit
The income taken into consideration in the study is the income tax per consumption unit. In a given dwelling, the amount of income tax declared to the tax authorities is calculated according to the number of taxable households resident in the dwelling. This sum is then divided by the number of consumption units (CU), determined as follows : − the first adult occupant is counted as 1 CU ; − any other occupant aged 14 or over accounts for 0.5 CU ; − each child occupant under the age of 14 accounts for 0.3 CU. In total each person of the same household will have the same income per consumption unit.
Pour en savoir plus
Rapport du Collège d’expertise sur le suivi statistique des risques psychosociaux au travail, ministère du Travail, de l’emploi et de la santé, 2011.