


 France's economic fabric more concentrated than it seemed New definition and new categories of enterprises
The new definition of French enterprises, based on economic criteria, allows a better description of the country's economic fabric. The profile that emerges is distinctly more concentrated than was previously thought. In 2009, in the non-farm and non-financial market sectors, 200 "large enterprises" employed 30% of payroll workers and generated one-third of market value added. That is more than twice the share measured for legal units with 5,000+ employees. The category whose share decreases most steeply consists of small and medium-sized enterprises (excluding micro-enterprises).
The new definition consolidates manufacturing firms with their service-sector affiliates. The sectoral breakdowns of value added, balance-sheet items, and exports have thus shifted in favor of manufacturing. The impact on the distribution of employment, however, is smaller. Overall, the new definition modifies sectoral balances less than it affects concentration by size.
These observations indicate a structural—i.e., long-term—pattern, as the analysis of data for 2004 and 2007 yielded similar findings.
- From the legal unit to the enterprise
- 2.69 million enterprises in non-farm market sectors
- A far more concentrated distribution of enterprises than measured by legal units
- Incorporating service-sector affiliates and subsidiaries increases the weight of manufacturing and construction
- Exports concentrated among a few manufacturing enterprises
- A largely stable structure over time
- Box 1 - New definition of the enterprise and initial approach
- Box 2 - Industry and sector: what is the share of manufacturing?
From the legal unit to the enterprise
The new definition of the enterprise in France, introduced by Decree no. 2008-1354 of December 18, 2008, offers a more realistic vision of the breakdown of production by enterprise size and activity sector (box 1). Previously, a legally-oriented approach prevailed, whereby the enterprise was equated with the legal unit (unincorporated or incorporated business). Since the 2008 decree, the enterprise has been defined on economic criteria. Its boundaries can exceed those of the legal unit and encompass several units, when these are interlinked within enterprise groups.
In practice, many group affiliates and subsidiaries are units lacking in autonomy or even, sometimes, substance. They have been formed as a result of takeovers or for internal reasons and strictly management-related objectives. Their only significance resides in their interaction with other group entities. Examples include firms that perform specific phases of the production process or are set up to manage an enterprise group's entire workforce. Others, instead, report production activity even with zero employees. These affiliates and subsidiaries are now treated as an integral part of the groups to which they report.
tableauTableau 1 – Enterprises and legal units in 2009 by category of Decree no. 2008-1354
| Large enterprises | ISEs1 | SMEs excl. micro- enterprises | Micro- enterprises | Total | ||
|---|---|---|---|---|---|---|
| Number of enterprises | Total | 217 | 4,576 | 131,253 | 2,555,003 | 2,691,049 |
| LUs2 excl. groups3 | s | 490 | 100,900 | 2,545,918 | 2,647,308 | |
| French groups | 148 | 2,806 | 25,781 | 7,324 | 36,059 | |
| Controlled by foreign group | 69 | 1,280 | 4,572 | 1,761 | 7,682 | |
| Paid employees of enterprises | Total | 3,986,077 | 2,877,952 | 3,529,842 | 2,377,504 | 12,771,375 |
| LUs excl. groups | s | 166,842 | 2,077,727 | 2,336,584 | 4,581,153 | |
| French groups | 3,395,746 | 1,763,368 | 1,232,986 | 33,463 | 6,425,563 | |
| Controlled by foreign group | 590,331 | 947,742 | 219,129 | 7,457 | 1,764,659 | |
| Number of LUs in France | Total | 24,937 | 40,141 | 188,686 | 2,565,147 | 2,818,911 |
| LUs excl. groups | s | 490 | 100,900 | 2,545,918 | 2,647,308 | |
| French groups | 22,040 | 31,893 | 80,081 | 17,095 | 151,109 | |
| Controlled by foreign group | 2,897 | 7,758 | 7,705 | 2,134 | 20,494 | |
- s: statistical confidentiality rules apply.
- 1. ISEs: intermediate-sized enterprises.
- 2. LUs: legal units.
- 3. There are fewer than three legal units (other than groups) whose size qualifies them as “large enterprises.” We have aggregated them with French groups to preserve statistical confidentiality.
- Note: The study is confined to enterprises reporting positive sales figures in 2009. This criterion excludes about 140,000 legal units.
- Scope of coverage: non-farm enterprises (but including enterprises in the financial/insurance sector) excluding “self-entrepreneurs” and general government.
- Sources: INSEE, ESANE, and 2009 LIFI.
2.69 million enterprises in non-farm market sectors
Applying an initial approach to the new definition, and considering each group as a single enterprise (box 1), France had 2.69 million enterprises operating in non-farm market sectors in 2009. Of the total, 2.65 million consisted of a single legal unit each, and 44,000 comprised several units (table 1). Of the latter, 36,000 were French-controlled groups and 8,000 were controlled by foreign groups.
The new definition of the enterprise reveals the extreme duality of France's economic fabric, attributable to the importance of enterprise groups. In formal terms, groups account for only 2% of enterprises and 6% of legal units in France. Yet they employ 64% of payroll workers, including 50% in French-owned groups and 14% in foreign-owned groups. Similarly, enterprise groups produce 70% of total value added by the business sector (excluding the financial sector, which is not accurately measured by accounting-based value added).
The 2008 Decree defines four sizes of enterprises on the basis of workforce size, sales (turnover), and total assets. The concentration of the economic fabric is visible in this classification as well. In 2009, 2.56 million French enterprises of the non-farm market sectors, or 95% of the total, were micro-enterprises. They employed 19% of all payroll workers. At the opposite end, 217 large enterprises employed 31% of payroll workers. In the size categories in between, jobs were rather evenly distributed: some 131,000 small and medium-sized enterprises (SMEs, understood here as excluding micro-enterprises) and 4,600 intermediate-sized enterprises (ISEs) employed 28% and 23% of payroll workers respectively (table 1).
graphiqueChart – Shares of legal units and enterprise categories in total Franch economy, by size, in 2009
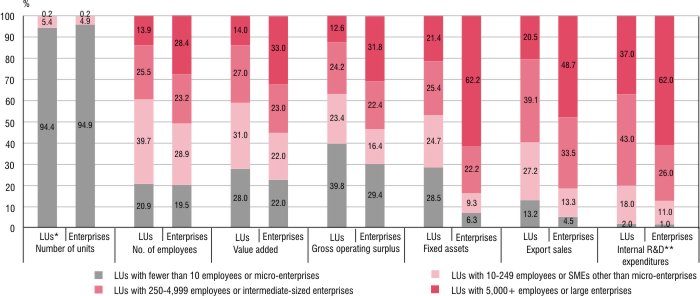
- *LU: legal unit. ** R&D: research and development.
- How to read this chart: 94.4% of legal units have fewer than 10 employees; they employ 20.9% of all payroll workers; 94.9% of enterprises are micro-enterprises; they employ 19.5% of all payroll workers.
- Scope of coverage: market sectors excluding agriculture and finance/insurance.
- Sources: INSEE, ESANE, and 2009 LIFI; Ministry of Higher Education and Research, Research and Development Survey, results for 2006.
A far more concentrated distribution of enterprises than measured by legal units
Before the 2008 Decree, economic concentration was usually measured by the economic weight of legal units in different workforce-size categories. With legal units of the financial sector now excluded—as their accounting aggregates are not comparable with those of other sectors—the official number of legal units in 2009 came to 2.76 million. Only a hundred or so exceeded the threshold of 5,000 employees that defines large enterprises. They employed 14% of all payroll workers (chart). When intra-group links are factored in, and with the addition of the sales and total-assets criteria, the concentration is far higher. The number of large enterprises rises to approximately 200. They employ 28% of payroll workers in the scope of coverage. Their economic weight is twice that of legal units with 5,000+ employees. They generate 33% of value added in the scope of coverage (17% of GDP), more than twice that of legal units of comparable workforce size. In 2006, they concentrated 62% of domestic research and development expenditure, versus 37% for legal units of comparable workforce size. Large enterprises represent an even larger share of balance-sheet variables. They alone account for 62% of fixed assets, versus 21% for legal units of 5,000+ employees.
Symmetrically, the weight of the other three enterprise categories is less significant, relative to legal units in the same workforce-size category. For most aggregates, the steepest decline in weight concerns SMEs. The reason is that a significant proportion of legal units of their size (10-249 employees) consists of affiliates and subsidiaries of groups in a larger size category (ISE or large enterprise), which are now amalgamated with those groups under the new criteria (chart).
Incorporating service-sector affiliates and subsidiaries increases the weight of manufacturing and construction
The new definition of the enterprise also changes the perception of the weight of each sector (box 2). Large industrial groups comprise many affiliates and subsidiaries in their core businesses. However, they also often set up separate affiliates and subsidiaries to perform sales/marketing or support functions, classified in the service sector. The inclusion of these units in the manufacturing sector increases the manufacturing workforce by 8%. This translates into a 2-point increase in the share of manufacturing in total non-farm and non-financial employment (table 2). The impact on value added is greater, with a 4-point increase. The explanation is that service-sector affiliates and subsidiaries of industrial groups often generate higher profit margins. Some of these units are set up to invoice production, while others perform highly skilled functions such as head-office activities, financing, and research. The same mechanism adds one point to the share of the construction industry in value added, whereas its share in employment is virtually unchanged.
The refocusing on manufacturing and construction is even more visible for certain aggregates that are particularly affected by spin-offs to affiliates and subsidiaries, such as net assets. Most groups have affiliates and subsidiaries classified under specialized activities (scientific and technical) or administrative and support services (notably including head offices). The legal units classified in these sectors hold 30% of net assets, but entities in this category that are full-fledged enterprises hold only 8%. Likewise, while legal units hold 11% of net assets, real-estate firms hold only 6%. Conversely, manufacturing enterprises hold 43% of net assets, whereas manufacturing legal units under the former definition held only 25%.
Exports concentrated among a few manufacturing enterprises
France's leading exporters consist of large enterprises and ISEs. In the non-farm and non-financial market sector, 186 large enterprises (out of 193) and 3,300 ISEs (out of 4,405) accounted for 49% and 33% of total exports respectively in 2009; 43,000 SMEs accounted for 13%, and 285,000 micro-enterprises for only 5% (chart). More than 80% of micro-enterprises are engaged in retailing and personal services, so some of their sales may have been to foreign tourists. When exports invoiced by service-sector affiliates and subsidiaries of manufacturing groups are included in the groups' accounts, the share of manufacturing in total exports rises from 57% to 64% (table 2). Conversely, while legal units in the wholesale/retail sector account for 23% of total exports, their share falls to 17% if we consider "pure" wholesale/retail enterprises excluding affiliates and subsidiaries of groups in other sectors. Sixty-eight large manufacturing enterprises alone generate 36% of the total economy's export sales; 1,500 manufacturing ISEs account for another 22%.
tableauTableau 2 – Sector weights measured by legal units and enterprises in 2009
| Manufacturing | Construction | Wholesale/retail, transportation, accomodation, and restaurants | Real-estate activities | Specialized activities, scientific and technical activities, administrative and support services | Other services | Total | ||
|---|---|---|---|---|---|---|---|---|
| Number of units | LUs* | 7.5 | 14.2 | 32.4 | 5.3 | 15.7 | 24.8 | 100.0 |
| Enterprises | 7.3 | 14.6 | 32.8 | 4.7 | 15.1 | 25.4 | 100.0 | |
| Number of employees | LUs | 25.2 | 10.9 | 36.5 | 1.6 | 13.9 | 11.9 | 100.0 |
| Enterprises | 27.5 | 11.2 | 36.7 | 1.5 | 12.3 | 10.9 | 100.0 | |
| Value added | LUs | 24.9 | 9.0 | 31.2 | 4.0 | 15.6 | 15.3 | 100.0 |
| Enterprises | 29.1 | 10.0 | 29.7 | 3.1 | 13.1 | 14.9 | 100.0 | |
| Gross operating surplus | LUs | 20.1 | 6.7 | 27.5 | 9.8 | 12.7 | 23.1 | 100.0 |
| Enterprises | 23.4 | 9.1 | 25.7 | 7.0 | 12.0 | 22.8 | 100.0 | |
| Fixed assets | LUs | 25.2 | 4.7 | 21.4 | 11.3 | 30.1 | 7.3 | 100.0 |
| Enterprises | 43.2 | 6.2 | 27.4 | 6.1 | 7.9 | 9.1 | 100.0 | |
| Export sales | LUs | 56.7 | 1.1 | 30.4 | 0.2 | 8.2 | 3.3 | 100.0 |
| Enterprises | 63.6 | 1.3 | 23.9 | 0.2 | 5.1 | 5.9 | 100.0 | |
- *LUs: legal units.
- How to read this chart: 7.5% of legal units have a principal activity in the manufacturing sector, versus 7.3% of enterprises. When enterprises rather than legal units are measured, the share of manufacturing in private-sector payroll employment rises from 25.2% to 27.5%.
- Scope of coverage: market sectors excluding agriculture and finance/insurance.
- Sources: INSEE, ESANE, and 2009 LIFI.
A largely stable structure over time
The changes entailed by the new definition of the enterprise are structural—i.e., long-term—in nature. The shift in the sectoral breakdown toward manufacturing and construction, as well as the highly uneven impact on each variable, had already been established for the years 2004 and 2007, with orders of magnitude comparable to those of 2009. Likewise, the shares of the different enterprise categories in the economy and their sectoral composition display very little change over time (references). The new approach does not call into question the broad trends—such as the expansion of the tertiary sector—or international comparisons.
Box 1 - New definition of the enterprise and initial approach
Article 1 of Decree no. 2008-1354, promulgated to implement the Economic Modernization Act, defines the enterprise in the same terms as European Economic Community (EEC) Council Regulation no. 696/93 of March 15, 1993: "the smallest combination of legal units that is an organizational unit producing goods or services, which benefits from a certain degree of autonomy in decision-making, especially for the allocation of its current resources." Accordingly, a group may have one subsidiary dedicated to the manufacture of goods and another to their sale. These two legal units, which are subsidiaries of the same group, must be combined in order to constitute an enterprise in the economic sense of the term.
The subsequent articles of the Decree seek to offer precise descriptions of enterprise categories with the aim of defining ISEs (intermediate-sized enterprises) and the specific criteria for SMEs.
The present study treats all groups of companies as single enterprises. This is an approximation, as certain diversified conglomerates (such as Bouygues, LVMH, and General Electric) comprise relatively autonomous segments engaged in different businesses. By logic, such segments should be viewed as separate enterprises operating in different sectors. Identifying enterprises under the criteria of the Decree within large, complex groups is a vast undertaking known as group profiling. It is currently under way in France and the other European countries. It will alter the number of large enterprises (whose order of magnitude may rise from 200 to 300) and, marginally, the number of intermediate-sized enterprises (by about 100, out of nearly 5,000), as well as certain distributions by sector. However, there will be practically no impact on the main findings of this study.
The principal activities of groups are defined by an algorithm from those of the affiliates and subsidiaries. The principal activity is the one that occupies the largest share of the workforce, not counting the head office and support functions.
Box 2 - Industry and sector: what is the share of manufacturing?
There are different ways of measuring the share of an economic activity in a country's total economy. One example is the measurement of the manufacturing industry's share of GDP, using national-accounting data.
One approach, called the industry-based approach (in French: par branche), measures the share of a particular activity irrespective of the enterprises that engage in it. In France, the value added by manufacturing activities represented 11.5% of GDP in 2009.
Another approach, called the sector-based (in French: par secteur) approach, measures the share of enterprises engaged in a given principal activity by aggregating all their activities:
- If we consider the sector of legal units whose principal activity is manufacturing, its share is slightly higher than in the industry-based approach at 12.6% of GDP. The difference is due to the fact that some manufacturing legal units also engage in secondary activities in the tertiary (service) sector, whose value added is accordingly included in the manufacturing total.
- If we consider the sector of manufacturing enterprises—the approach emphasized in this study—the manufacturing share is an even greater 14.7% of GDP. Here, the service-sector subsidiaries of manufacturing groups are included in the total.
Définitions
An activity sector is composed of production units engaged in the same principal activity.
A group is a set of companies interlinked through shareholdings and controlled by a single company.
The four categories of enterprises, as defined by Decree no. 2008-1354, are as follows:
- Micro-enterprises employ fewer than 10 people and their annual sales or total assets do not exceed € 2 million.
- Small and medium-sized enterprises (SMEs) employ fewer than 250 people and their annual sales do not exceed € 50 million or their total assets do not exceed € 43 million. In our study, "SMEs" means SMEs excluding micro-enterprises, even though the latter are, by definition, SMEs.
- Intermediate-sized enterprises (ISEs) do not belong to the SME category, employ fewer than 5,000 people and their annual sales do not exceed € 1,500 million or their total assets do not exceed € 2,000 million.
- Large enterprises are the enterprises not classified in the categories above.
An industry (branche d'activité) is composed of homogeneous production units, i.e., producing products (or providing services) that belong to the same item in a classification of activities.
Pour en savoir plus
