


 24 July 2018
2018- n° 186In July 2018, the business climate falters slightly in manufacturing but remains at
a high level Monthly business survey (goods-producing industries) - July 2018
24 July 2018
2018- n° 186In July 2018, the business climate falters slightly in manufacturing but remains at
a high level Monthly business survey (goods-producing industries) - July 2018
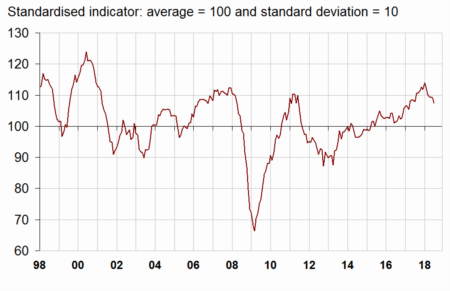
According to the business managers surveyed in July 2018, the business climate in industry has slightly edged down. The composite indicator has decreased by one point as in June, after having recovered slightly in May. At 108, it remains well above its long-term average (100).
- Manufacturers have reported smaller order books
- In the agrofood industry, the business climate has deteriorated
- The business climate has further slightly faltered in the manufacture of machinery and equipment goods
- The business climate in the manufacture of transport equipment is less favourable
- The business climate has slightly improved in “other manufacturing industries”
- Revisions
According to the business managers surveyed in July 2018, the business climate in industry has slightly edged down. The composite indicator has decreased by one point as in June, after having recovered slightly in May. At 108, it remains well above its long-term average (100).
graphiqueGraph 1 – Business climate in industry - Composite indicator
The turning-point indicator remains in the uncertainty area.
graphiqueGraph 2 – Turning-point indicator
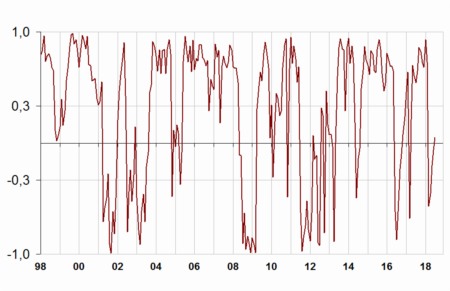
- How to read it: close to 1 (resp. -1), the indicator points to a favourable short-term economic situation (resp. unfavourable). The uncertainty area is between -0.3 and +0.3.
Manufacturers have reported smaller order books
Manufacturers are considerably less optimistic than at the beginning of the year about the general production prospects for the sector. Nevertheless, the corresponding balance remains well above its long-term average. Their opinion on overall and export order books have slightly further deteriorated. At the beginning of the year, the corresponding balances had reached levels not seen since December 2007.
The balance of industrialists' opinion on personal production expectations has slightly decreased after reaching in June its highest level since November 2000. That on past activity has edged down by one point back to its long-term average.
As many industrialists as in June consider that their finished-goods inventories are above normal. The corresponding balance is below its long-term mean.
As regards employment, the balance of opinion on expected workforce size has fallen back while that on past workforce size remains stable. Both balances are well above their long-term average.
tableauTable 1 – Industrialists' opinion on manufacturing activity
| Manufacturing industry | Ave.* | April 18 | May 18 | June 18 | July 18 |
|---|---|---|---|---|---|
| Composite indicator | 100 | 109 | 110 | 109 | 108 |
| Past activity | 5 | 7 | 11 | 6 | 5 |
| Finished-goods inventory | 13 | 5 | 9 | 9 | 9 |
| Overall order books | –18 | 1 | 1 | –1 | –6 |
| Export order books | –14 | 1 | –1 | –2 | –4 |
| Past workforce size | –10 | 4 | 3 | 3 | 3 |
| Expected workforce size | –12 | 3 | 3 | 4 | 0 |
| Personal production expectations | 5 | 15 | 17 | 24 | 22 |
| General production expectations | –8 | 23 | 15 | 14 | 10 |
- * Long-term average since 1976.
- Source: INSEE - Monthly business tendency survey in industry
In the agrofood industry, the business climate has deteriorated
In the manufacture of food products and beverages, the business climate indicator has narrowed in July (–4 points). At 107, it still considerably exceeds its long-term average (100). This deterioration mainly comes from a decrease in the balances on overall and export order books.
The business climate has further slightly faltered in the manufacture of machinery and equipment goods
In the overall manufacture of machinery and equipment goods, the business climate has decreased by one point, at 107, while remaining well above its long-term average. This dip is attributable to the decrease in the balance on past activity.
The business climate is less favourable in the electrical equipment industry and in machinery and equipment than in June. By contrast, it has improved in the computer, electronic and optical product industry.
The business climate in the manufacture of transport equipment is less favourable
In the manufacture of transport equipment, the business climate has fallen by four points. At 106, it remains above its long-term average (100). This deterioration mainly comes from the decrease in the balance on overall order books, in particular in the motor vehicles, trailers and semi-trailers industry.
The business climate indicator has decreased in the manufacture of motor vehicles, trailers and semi-trailers, and slightly less in the manufacture of other transport equipment. In both cases, the climate remains above average.
The business climate has slightly improved in “other manufacturing industries”
In overall “other manufacturing”, the business climate is slightly more favourable. The composite indicator has edged up by 1 point. This improvement mainly comes from the increase in the balance on personal production expectations.
By subsector, the business climate indicator has brightened in rubber and plastic products. It is stable in chemicals and in the “other manufacturing industries” and has fallen in wood-paper, clothing-textiles and basic metals.
graphiqueGraph 3 – Business climates in a sector-based approach
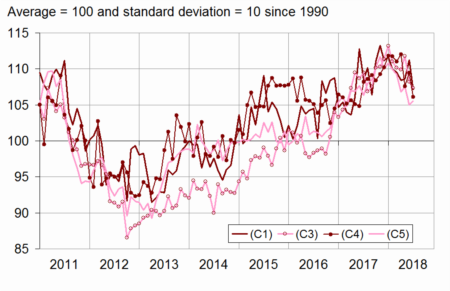
- Legend: (C1): Manufacture of food products and beverages - (C3): Machinery and equipment goods - (C4): Manufacture of transport equipment - (C5): Other manufacturing
tableauTable 2 – Business climates in a sector-based approach
| NA* : (A17) et [A38 et A64] | Weights** (%) | May 18 | June 18 | July 18 |
|---|---|---|---|---|
| (C1) Man. of food products and beverages | 22 | 109 | 111 | 107 |
| (C3) Machinery and equipment goods | 11 | 112 | 108 | 107 |
| [CI] Computer, electronic and optical products | 3 | 108 | 104 | 106 |
| [CJ] Electrical equipment | 3 | 110 | 108 | 107 |
| [CK] Machinery and equipment | 5 | 113 | 110 | 108 |
| (C4) Man. of transport equipment | 15 | 108 | 110 | 106 |
| [CL1] Motor vehicles, trailers and semi-trailers | 7 | 106 | 109 | 105 |
| [CL2] Other transport equipment | 8 | 104 | 106 | 105 |
| (C5) Other manufacturing | 46 | 108 | 105 | 106 |
| [CB] Textiles, clothing industries, leather and footwear industry | 2 | 112 | 113 | 110 |
| [CC] Wood, paper, printing | 5 | 110 | 111 | 109 |
| [CE] Chemicals and chemical products | 9 | 104 | 103 | 103 |
| [CG] Rubber and plastic products | 7 | 109 | 105 | 108 |
| [CH] Basic metals and fabricated metal products | 11 | 107 | 104 | 103 |
| [CM] Other manufacturing industries | 9 | 106 | 103 | 103 |
- * NA: aggregated classification, based on the French classification of activities NAF rév.2.
- ** Weights used to aggregate sub-sector's balances of opinion.
- Source: INSEE - Monthly business tendency survey in industry
Revisions
The business climate in manufacturing in June 2018 has been lowered from 110 to 109 since its first estimation published last month, mainly due to the inclusion of late responses from businesses.
Documentation
Methodology (pdf,133 Ko)
Pour en savoir plus
Time series : Industry - Activity and demand
