

 26 March 2018
2018- n° 81Non financial corporations' profit ratio and households' purchasing power grew slightly Quarterly national accounts - detailed figures - fourth quarter 2017
26 March 2018
2018- n° 81Non financial corporations' profit ratio and households' purchasing power grew slightly Quarterly national accounts - detailed figures - fourth quarter 2017
In Q4 2017, GDP in volume terms* accelerated: +0.7% after +0.5%. On average over the year, GDP increased by +2.0%. Exluding working-day adjustment, the GDP's growth stands at +1.8% in 2017, after +1.2% in 2016.
Household consumption expenditures slowed down in Q4 (+0.2% after +0.5%), whereas total gross fixed capital formation accelerated (GFCF: +1.1% after +0.9%). Overall, final domestic demand excluding inventory changes slowed down slighty and contributed less to GDP growth: +0.5 points after +0.6 points.
Exports accelerated sharply (+2.5% after +1.0%) while imports significantly slowed down (+0.3% after +2.2%). All in all, foreign trade balance contributed positively to GDP growth this quarter: +0.7 points after −0.4 points. Conversely, changes in inventories contributed negatively (−0.4 points after +0.3 points).
graphiqueGraph – GDP and its main components
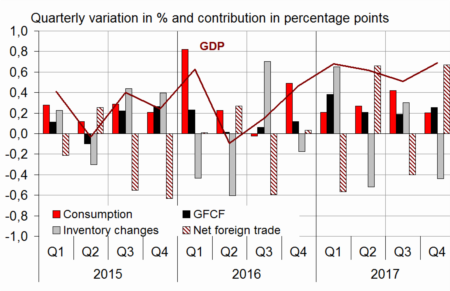
- Source: INSEE

* This growth rate is seasonally and working-day adjusted; volumes are chain-linked previous-year-prices volumes.
tableauTab1 – GDP and its main components: chain-linked volumes
| 2017 Q1 | 2017 Q2 | 2017 Q3 | 2017 Q4 | 2016 | 2017 | |
|---|---|---|---|---|---|---|
| GDP | 0.7 | 0.6 | 0.5 | 0.7 | 1.1 | 2.0 |
| Imports | 1.2 | 0.0 | 2.2 | 0.3 | 4.2 | 4.1 |
| Household consumption *expenditure | 0.2 | 0.3 | 0.5 | 0.2 | 2.1 | 1.3 |
| General government's *consumption expenditure | 0.3 | 0.5 | 0.6 | 0.3 | 1.2 | 1.6 |
| GFCF | 1.7 | 0.9 | 0.9 | 1.1 | 2.7 | 3.8 |
| *of which Non-financial corporated and unincorporated enterprises | 2.4 | 1.0 | 1.1 | 1.5 | 3.4 | 4.4 |
| Households | 1.8 | 1.4 | 0.9 | 0.6 | 2.4 | 5.3 |
| General government | –0.6 | 0.1 | –0.2 | 0.5 | –0.1 | –1.0 |
| Exports | –0.7 | 2.2 | 1.0 | 2.5 | 1.9 | 3.3 |
| Contributions: | ||||||
| Internal demand excluding inventory changes | 0.6 | 0.5 | 0.6 | 0.5 | 2.0 | 1.9 |
| Inventory changes | 0.7 | –0.5 | 0.3 | –0.4 | –0.1 | 0.4 |
| Net foreign trade | –0.6 | 0.7 | –0.4 | 0.7 | –0.8 | –0.3 |
- Source: INSEE
tableauTab2 – Production, consumption and GFCF: main components
| 2016 Q1 | 2017 Q2 | 2017 Q3 | 2017 Q4 | 2016 | 2017 | |
|---|---|---|---|---|---|---|
| Production of branches | 0.7 | 0.8 | 0.7 | 1.0 | 0.9 | 2.4 |
| Goods | 0.2 | 0.7 | 0.9 | 1.3 | 0.2 | 2.0 |
| Manufactured Industry | 0.2 | 0.8 | 0.8 | 1.5 | 0.8 | 2.0 |
| Construction | 0.7 | 1.0 | 0.4 | 0.5 | 0.1 | 2.6 |
| Market services | 1.1 | 0.8 | 0.7 | 1.0 | 1.4 | 2.8 |
| Non-market services | 0.3 | 0.5 | 0.6 | 0.4 | 1.0 | 1.4 |
| Household consumption | 0.2 | 0.3 | 0.5 | 0.2 | 2.1 | 1.3 |
| Food products | 0.3 | 0.5 | –0.5 | 0.3 | 0.9 | 0.8 |
| Energy | –2.3 | –0.3 | 1.3 | –0.2 | 2.1 | 0.0 |
| Engineered goods | 0.4 | 0.3 | 1.2 | –0.2 | 2.4 | 1.7 |
| Services | 0.6 | 0.3 | 0.6 | 0.5 | 1.6 | 1.8 |
| GFCF | 1.7 | 0.9 | 0.9 | 1.1 | 2.7 | 3.8 |
| Manufactured goods | 2.0 | 0.2 | 1.3 | 1.7 | 6.1 | 1.8 |
| Construction | 0.7 | 1.1 | 0.5 | 0.5 | 0.2 | 2.6 |
| Market services | 2.9 | 1.2 | 1.1 | 1.6 | 3.9 | 6.5 |
- Source: INSEE
Purchasing power decelerated in Q4 2017 and in the year as a whole
Households' gross disposable income (GDI) accelerated slightly in Q4 2017 (+0.7% after +0.6%).
Social benefits in cash perceived by households remained dynamic (+0.6% after +0.5%), carried by the reevalution of retirement benefits on october 1st 2017, and social contribution payed by households decelerated slightly (+0.8% after +0.9%).
Wages received by households kept increasing at a fast pace (+0.7% after +0.6%): in the private sector, the average wage per capita accelerated a little and employment remained dynamic. Households' consumption prices increased at a faster pace this quarter (+0.5% after +0.1%), such that households' purchasing power slowed down (+0.2% after +0.5%). Over the entire year, it decelerated as well (+1.5% after +1.8% in 2016) with the acceleration of prices. When measured per consumption unit, it grew by +1.1% in 2017, after +1.4% in 2016.
Households' consumption grew at the same rate as their purchasing power (+0.2%), such that their savings rate remained stable this quarter: it stands at 14.2% of their income. On average over the year, it increased slightly (14.2% after 14.0% in 2016).
tableauTab3 – Sectoral accounts
| 2017 Q1 | 2017 Q2 | 2017 Q3 | 2017 Q4 | 2016 | 2017 | |
|---|---|---|---|---|---|---|
| Profit ratio of NFCs* (level) | 31.5 | 31.7 | 31.7 | 31.8 | 31.8 | 31.7 |
| Households' purchasing power | 0.2 | 0.6 | 0.5 | 0.2 | 1.8 | 1.5 |
- *NFCs: non-financial corporations
- Source: INSEE
tableauTab4 – Households' disposable income and ratios of households' account
| 2017 Q1 | 2017 Q2 | 2017 Q3 | 2017 Q4 | 2016 | 2017 | |
|---|---|---|---|---|---|---|
| HDI | 0.7 | 0.5 | 0.6 | 0.7 | 1.7 | 2.4 |
| Household purchasing power | 0.2 | 0.6 | 0.5 | 0.2 | 1.8 | 1.5 |
| HDI by cu* (purchasing power) | 0.1 | 0.5 | 0.4 | 0.1 | 1.4 | 1.1 |
| Adjusted HDI (purchasing power) | 0.3 | 0.6 | 0.5 | 0.2 | 1.7 | 1.6 |
| Saving rate (level) | 14.0 | 14.3 | 14.2 | 14.2 | 14.0 | 14.2 |
| Financial saving rate (level) | 4.3 | 4.4 | 4.4 | 4.5 | 4.7 | 4.4 |
- *cu: consumption unit
- Source: INSEE
Non-financial corporations' profit ratio was virtually stable at 31.8% in Q4 2017
In Q4 2017, non-financial corporations' profit ratio remained almost stable at 31.8% (after 31.7%). The rise of energy prices was compensated by an increase in productivity.
On average over the year, non-financial corporations' profit ratio took a slight step back, at 31.7% in 2017 after 31.8% in 2016. Real wages grew faster than productivity. Moreover, after sustaining the profit ratio in 2016, the terms of trade weighed it down slightly in 2017 with the rise of energy prices.
tableauTab5 – Ratios of non-financial corporations' account
| 2017 Q1 | 2017 Q2 | 2017 Q3 | 2017 Q4 | 2016 | 2017 | |
|---|---|---|---|---|---|---|
| Profit share | 31.5 | 31.7 | 31.7 | 31.8 | 31.8 | 31.7 |
| Investment ratio | 23.7 | 23.8 | 23.9 | 24.0 | 23.3 | 23.8 |
| Savings ratio | 19.7 | 19.7 | 19.9 | 19.1 | 19.7 | 19.6 |
| Self-financing ratio | 82.9 | 82.8 | 83.2 | 79.5 | 84.3 | 82.1 |
- Source: INSEE
General government deficit decreased in Q4 2017
General government deficit decreased by 0.7 points of GDP in Q4 2017: 2.1% of GDP after 2.8%. Over the year, it accounted for 2.6% of GDP (an estimation in line with the first annual account estimate notified to the European Commission).
Spending stepped back slightly in Q4 2017 (+0.7 in current euros % after +1.0%). The decrease of France's contribution to European budget mitigated the spendings related to refunding businesses for the 3% tax on dividends. Meanwhile, revenue accelerated (+2.0% after +0.6%), mainly because of the exceptional contribution payed by big businesses at the end of the year to finance the refund of the tax on dividends.
tableauTab6 – Expenditure. receipts and net borrowing of public administrations)
| 2017 Q1 | 2017 Q2 | 2017 Q3 | 2017 Q4 | 2016 | 2017 | |
|---|---|---|---|---|---|---|
| In billions of euros | ||||||
| Total expenditure | 319.4 | 321.3 | 324.5 | 326.9 | 1260.7 | 1292.2 |
| Total receipts | 302.5 | 306.7 | 308.5 | 314.8 | 1184.8 | 1232.6 |
| Net lending (+) or borrowing (–) | –17.0 | –14.6 | –16.0 | –12.0 | –75.8 | –59.6 |
| In % of GDP | ||||||
| Net lending (+) or borrowing (–) | –3.0 | –2.6 | –2.8 | –2.1 | –3.4 | –2.6 |
- Source: INSEE
Revisions
The estimation of GDP growth for this quarter increased slightly to reach +0.7%. This mostly owes to indicators revising and to the update of the working-day adjustment.
GDP growth is confirmed at +2.0% in 2017.