

 22 December 2017
2017- n° 342French GDP increased by 0.6% in Q3 2017 Quarterly national accounts - detailed figures - third quarter 2017
22 December 2017
2017- n° 342French GDP increased by 0.6% in Q3 2017 Quarterly national accounts - detailed figures - third quarter 2017
In Q3 2017, gross domestic product (GDP) in volume terms* kept increasing at the same rate as it had in Q2: +0.6%.
Household consumption expenditure accelerated (+0.6% after +0.3%), while total gross fixed capital formation (GFCF) remained dynamic (+0.9% after +1.1%). All in all, final domestic demand excluding changes in inventories increased: it contributed by +0.6 points to GDP growth in Q3 2017 (after +0.5 %).
The foreign trade balance contributed negatively to GDP growth (−0.6 points after +0.6 points): imports accelerated sharply (+2.6% after +0.1%) while exports decelerated significantly (+0.8% after +2.0%). Conversely, changes in inventories contributed positively to GDP growth (+0.5 points after −0.4 points).

*This growth rate is seasonally and working-day adjusted; volumes are chain-linked previous-year-prices volumes.
graphiqueGraph – GDP and its main components
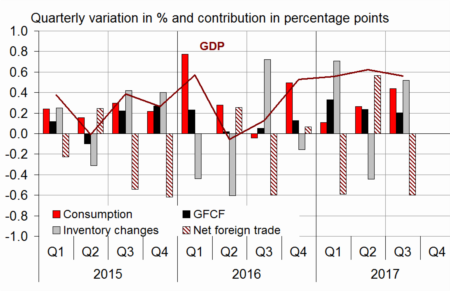
- Source: INSEE
tableauTab1 – GDP and its main components: chain-linked volumes
| 2016 Q4 | 2017 Q1 | 2017 Q2 | 2017 Q3 | 2016 | 2017 (ovhg) | |
|---|---|---|---|---|---|---|
| GDP | 0.5 | 0.6 | 0.6 | 0.6 | 1.1 | 1.8 |
| Imports | 0.9 | 1.2 | 0.1 | 2.6 | 4.2 | 4.4 |
| Household consumption *expenditure | 0.8 | 0.0 | 0.3 | 0.6 | 2.1 | 1.1 |
| General government's *consumption expenditure | 0.3 | 0.3 | 0.5 | 0.6 | 1.2 | 1.5 |
| GFCF | 0.6 | 1.5 | 1.1 | 0.9 | 2.7 | 3.4 |
| *of which Non-financial corporated and unincorporated enterprises | 0.6 | 2.2 | 1.2 | 1.1 | 3.4 | 4.1 |
| Households | 1.3 | 1.6 | 1.4 | 1.1 | 2.4 | 4.9 |
| General government | −0.7 | −0.8 | 0.2 | −0.2 | −0.1 | −1.4 |
| Exports | 1.2 | −0.7 | 2.0 | 0.8 | 1.9 | 2.5 |
| Contributions: | ||||||
| Internal demand excluding inventory changes | 0.6 | 0.4 | 0.5 | 0.6 | 2.0 | 1.7 |
| Inventory changes | −0.2 | 0.7 | −0.4 | 0.5 | −0.1 | 0.8 |
| Net foreign trade | 0.1 | −0.6 | 0.6 | −0.6 | −0.8 | −0.7 |
- Source: INSEE
tableauTab2 – Production, consumption and GFCF: main components
| 2016 Q4 | 2017 Q1 | 2017 Q2 | 2017 Q3 | 2016 | 2017 (ovhg) | |
|---|---|---|---|---|---|---|
| Production of branches | 0.7 | 0.6 | 0.8 | 0.7 | 0.9 | 2.1 |
| Goods | 0.8 | −0.1 | 0.8 | 0.9 | 0.2 | 1.5 |
| Manufactured Industry | 0.4 | 0.1 | 0.8 | 0.8 | 0.8 | 1.6 |
| Construction | 0.9 | 0.6 | 1.1 | 0.3 | 0.1 | 2.4 |
| Market services | 0.7 | 0.9 | 0.8 | 0.8 | 1.4 | 2.5 |
| Non-market services | 0.3 | 0.3 | 0.4 | 0.5 | 1.0 | 1.3 |
| Household consumption | 0.8 | 0.0 | 0.3 | 0.6 | 2.1 | 1.1 |
| Food products | −0.1 | 0.4 | 0.6 | −0.5 | 0.9 | 0.7 |
| Energy | 3.8 | −3.7 | 0.5 | 1.3 | 2.1 | −0.4 |
| Engineered goods | 1.7 | 0.1 | 0.4 | 1.4 | 2.4 | 1.5 |
| Services | 0.4 | 0.6 | 0.2 | 0.6 | 1.6 | 1.6 |
| GFCF | 0.6 | 1.5 | 1.1 | 0.9 | 2.7 | 3.4 |
| Manufactured goods | −0.4 | 1.9 | 0.6 | 1.5 | 6.1 | 1.7 |
| Construction | 0.8 | 0.6 | 1.2 | 0.5 | 0.2 | 2.4 |
| Market services | 0.9 | 2.3 | 1.3 | 1.0 | 3.9 | 5.7 |
- Source: INSEE
Purchasing power grew by 0.5 % in Q3 2017
In Q3 2017, households' gross disposable income (GDI) increased at the same rate as it had in the previous quarter (+0.6%). Wages received by households remained dynamic (+0.7%); in the private sector, employment decelerated slightly while the average wage per capita accelerated a little with inflation. Social benefits in cash perceived by households accelerated (+0.5% after +0.3%). Finally, insurance indemnities soared this quarter, following the damage caused by hurricanes Irma and Maria in the Antilles.
Taxes on income and wealth, which contain the generalised social contribution (CSG) and the income tax, accelerated significantly (+1.4% after +0.7%).
Meanwhile, social contribution payed by households grew slightly faster than in the previous quarter (+0.7% after +0.6%).
Furthermore, households' consumption prices recovered a little this quarter (+0.1% after -0.1%), such that households' purchasing power slowed down (+0.5% after +0.8%). When measured per consumption unit to bring it to an individual level, it decelerated as well (+0.4% after +0.7%).
In Q3 2017, households' consumption in volume terms increased slightly more than their purchasing power, such that their saving rate remained nearly stable, 14.5% of their income after 14.6%.
tableauTab3 – Sectoral accounts
| 2016 Q4 | 2017 Q1 | 2017 Q2 | 2017 Q3 | 2016 | 2017 (ovhg) | |
|---|---|---|---|---|---|---|
| Profit ratio of NFCs* (level) | 31.6 | 31.5 | 31.7 | 31.7 | 31.8 | |
| Households' purchasing power | 0.3 | 0.2 | 0.8 | 0.5 | 1.8 | 1.6 |
- *NFCs: non-financial corporations
- Source: INSEE
tableauTab4 – Households' disposable income and ratios of households' account
| 2016 Q4 | 2017 Q1 | 2017 Q2 | 2017 Q3 | 2016 | 2017 (ovhg) | |
|---|---|---|---|---|---|---|
| HDI | 0.5 | 0.7 | 0.6 | 0.6 | 1.7 | 2.4 |
| Household purchasing power | 0.3 | 0.2 | 0.8 | 0.5 | 1.8 | 1.6 |
| HDI by cu* (purchasing power) | 0.2 | 0.1 | 0.7 | 0.4 | 1.4 | 1.3 |
| Adjusted HDI (purchasing power) | 0.3 | 0.3 | 0.7 | 0.5 | 1.7 | 1.6 |
| Saving rate (level) | 14.0 | 14.2 | 14.6 | 14.5 | 14.0 | |
| Financial saving rate (level) | 4.7 | 4.6 | 4.8 | 4.8 | 4.7 |
- *cu: consumption unit
- Source: INSEE
Non-financial corporations' profit ratio remained stable at 31.7%
In Q3 2017, non-financial corporations' profit ratio was stable at 31.7%. Indeed, real wages and labour productivity increased at the same rate.
Non-financial corporations' taxes on incomes and wealth fell back significantly. All in all, gross savings of non-financial corporations accelerated slightly. Their investment slowed down a little. Their self-financing rate improved a bit, standing at 83.4% (after 83.0%); it nonetheless remained lower than its level at the beginning of 2016 (86.5%).
tableauTab5 – Ratios of non-financial corporations' account
| 2016 Q4 | 2017 Q1 | 2017 Q2 | 2017 Q3 | 2016 | |
|---|---|---|---|---|---|
| Profit share | 31.6 | 31.5 | 31.7 | 31.7 | 31.8 |
| Investment ratio | 23.3 | 23.7 | 23.8 | 23.9 | 23.3 |
| Savings ratio | 19.4 | 19.7 | 19.7 | 19.9 | 19.7 |
| Self-financing ratio | 83.2 | 83.0 | 83.0 | 83.4 | 84.2 |
- Source: INSEE
General government deficit deepened in Q3
In Q3 2017, general government net borrowing increased by 0.3 points, to 2.8% of GDP after 2.5%.
General government spending sped up (+1.0% after +0.3%), mainly because of the state participating in the increase of Areva SA's capital by an amount of 2.3 billion euros.
Meanwhile, receipts slowed down (+0.5% after +1.2%), in particular because of a downturn in the income tax payed by corporations and succession rights revenues.
tableauTab6 – Expenditure. receipts and net borrowing of public administrations
| 2016 Q3 | 2016 Q4 | 2017 Q1 | 2017 Q2 | 2016 | |
|---|---|---|---|---|---|
| In billions of euros | |||||
| Total expenditure | 315.0 | 316.9 | 317.9 | 321.3 | 1256.9 |
| Total receipts | 297.8 | 300.1 | 303.6 | 305.1 | 1181.1 |
| Net lending (+) or borrowing (−) | −17.2 | −16.9 | −14.3 | −16.1 | −75.8 |
| In % of GDP | |||||
| Net lending (+) or borrowing (−) | −3.1 | −3.0 | −2.5 | −2.8 | −3.4 |
- Source: INSEE
Revisions
The estimation of GDP growth for Q3 2017 has been increased by 0.1 points, at 0.6%, and the annual growth overhang now stands at +1.8% (after +1.7% in the previous estimation).