

 31 October 2017
2017- n° 290French GDP increased by 0.5% in Q3 2017 Quarterly national accounts - first estimate - third quarter 2017
31 October 2017
2017- n° 290French GDP increased by 0.5% in Q3 2017 Quarterly national accounts - first estimate - third quarter 2017
In Q3 2017, gross domestic product (GDP) in volume terms* kept increasing: +0.5%, after +0.6% in Q2.
Household consumption expenditure slightly accelerated (+0.5% after +0.3%) while total gross fixed capital formation (GFCF) remained dynamic (+0.8% after +1.0%). All in all, final domestic demand excluding changes in inventories increased: it contributed by +0.6 points to GDP growth in Q3 2017.
The foreign trade balance contributed negatively to GDP growth (−0.6 points after +0.6 points): imports accelerated sharply (+2.5% after +0.2%) while exports decelerated significantly (+0.7% after +2.3%). Conversely, changes in inventories contributed positively to GDP growth (+0.5 points after −0.5 points).
In comparison with Q3 2016, GDP rose by 2.2%; such a growth rate had not been observed since 2011

*This growth rate is seasonally and working-day adjusted; volumes are chain-linked previous-year-prices volumes..
graphiqueGraph – GDP and its main components
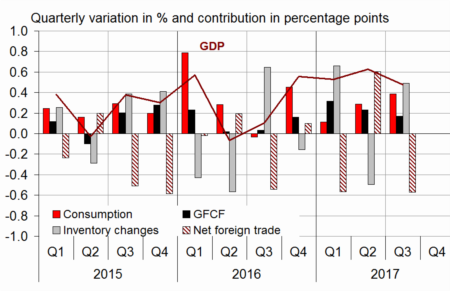
- Source: INSEE
tableauTab1 – GDP and its main components: chain-linked volumes
| 2016 Q4 | 2017 Q1 | 2017 Q2 | 2017 Q3 | 2016 | 2017 (ovhg) | |
|---|---|---|---|---|---|---|
| GDP | 0.6 | 0.5 | 0.6 | 0.5 | 1.1 | 1.7 |
| Imports | 0.8 | 1.2 | 0.2 | 2.5 | 4.2 | 4.3 |
| Household consumption *expenditure | 0.7 | 0.1 | 0.3 | 0.5 | 2.1 | 1.1 |
| General government's *consumption expenditure | 0.3 | 0.3 | 0.4 | 0.4 | 1.2 | 1.3 |
| GFCF | 0.7 | 1.4 | 1.0 | 0.8 | 2.7 | 3.3 |
| *of which Non-financial corporated and unincorporated enterprises | 0.9 | 2.1 | 1.1 | 0.9 | 3.4 | 3.9 |
| Households | 1.3 | 1.6 | 1.4 | 1.1 | 2.4 | 4.9 |
| General government | -0.6 | -0.8 | 0.2 | -0.2 | -0.1 | -1.5 |
| Exports | 1.2 | -0.7 | 2.3 | 0.7 | 1.9 | 2.7 |
| Contributions: | ||||||
| Internal demand excluding inventory changes | 0.6 | 0.4 | 0.5 | 0.6 | 2.0 | 1.6 |
| Inventory changes | -0.2 | 0.7 | -0.5 | 0.5 | -0.1 | 0.6 |
| Net foreign trade | 0.1 | -0.6 | 0.6 | -0.6 | -0.8 | -0.6 |
- Source: INSEE
Total production slightly decelerated
Production in goods and services slightly decelerated in Q3 2017 (+0.6% after +0.8%). Indeed, it rose practically at the same pace than in the previous quarter in goods (+0.8% after +0.7%), but slightly slowed down in services (+0.6% after +0.8%). In detail, output in manufactured goods kept on rising (+0.6% after +0.7%), mainly because of transport equipment (+3.1% after 0.0%), while production braked in construction (+0.3% after +1.2%).
tableauTab2 – Production, consumption and GFCF: main components
| 2016 Q4 | 2017 Q1 | 2017 Q2 | 2017 Q3 | 2016 | 2017 (ovhg) | |
|---|---|---|---|---|---|---|
| Production of branches | 0.7 | 0.6 | 0.8 | 0.6 | 0.9 | 2.1 |
| Goods | 0.9 | -0.1 | 0.7 | 0.8 | 0.2 | 1.5 |
| Manufactured Industry | 0.7 | -0.1 | 0.7 | 0.6 | 0.8 | 1.4 |
| Construction | 0.9 | 0.7 | 1.2 | 0.3 | 0.1 | 2.5 |
| Market services | 0.8 | 0.9 | 0.9 | 0.7 | 1.4 | 2.6 |
| Non-market services | 0.3 | 0.3 | 0.4 | 0.4 | 1.0 | 1.1 |
| Household consumption | 0.7 | 0.1 | 0.3 | 0.5 | 2.1 | 1.1 |
| Food products | -0.1 | 0.4 | 0.6 | -0.5 | 0.9 | 0.7 |
| Energy | 3.0 | -3.2 | 0.5 | 1.6 | 2.2 | -0.1 |
| Engineered goods | 1.6 | 0.0 | 0.5 | 1.3 | 2.4 | 1.5 |
| Services | 0.5 | 0.6 | 0.2 | 0.4 | 1.6 | 1.5 |
| GFCF | 0.7 | 1.4 | 1.0 | 0.8 | 2.7 | 3.3 |
| Manufactured goods | 0.0 | 1.8 | 0.5 | 0.8 | 6.1 | 1.3 |
| Construction | 0.8 | 0.6 | 1.2 | 0.5 | 0.2 | 2.4 |
| Market services | 1.1 | 2.2 | 1.2 | 1.0 | 3.9 | 5.7 |
- Source: INSEE
Household consumption accelerated in Q3 2017
Household consumption expenditure accelerated a little in Q3 2017 (+0.5% after +0.3%). Consumption of services regained some momentum (+0.4% after +0.2%) and consumption of goods remained dynamic (+0.7% after +0.6%).
In detail, expenditure on energy rose (+1.6% after +0.5%), notably because the temperatures in September were lower than the normal seasonal levels. Expenditure on manufactured goods accelerated (+1.3% after +0.5%), in particular with purchases of textile-clothing and furniture. In 2017, the sale season started a little bit later than in the previous years, which presumably bolstered the consumption in Q3 2017. In the accomodation and catering sector, consumption rose by +1.1% in Q3 2017.
tableauTab3 – Sectoral accounts
| 2016 Q4 | 2017 Q1 | 2017 Q2 | 2017 Q3 | 2016 | 2017 (ovhg) | |
|---|---|---|---|---|---|---|
| Profit ratio of NFCs* (level) | 31.7 | 31.6 | 31.8 | 31.8 | ||
| Households' purchasing power | 0.2 | 0.1 | 0.7 | 1.8 | 1.3 |
- *NFCs: non-financial corporations
- Source: INSEE
tableauTab4 – Households' disposable income and ratios of households' account
| 2016 Q4 | 2017 Q1 | 2017 Q2 | 2017 Q3 | 2016 | 2017 (ovhg) | |
|---|---|---|---|---|---|---|
| HDI | 0.5 | 0.7 | 0.6 | 1.7 | 2.0 | |
| Household purchasing power | 0.2 | 0.1 | 0.7 | 1.8 | 1.3 | |
| HDI by cu* (purchasing power) | 0.1 | 0.0 | 0.6 | 1.4 | 0.9 | |
| Adjusted HDI (purchasing power) | 0.2 | 0.2 | 0.7 | 1.7 | 1.3 | |
| Saving rate (level) | 14.0 | 14.1 | 14.4 | 14.0 | ||
| Financial saving rate (level) | 4.7 | 4.5 | 4.7 | 4.7 |
- *cu: consumption unit
- Source: INSEE
Corporate and household investment kept on increasing
Total GFCF rose again in Q3 2017 (+0.8% after +1.0%). Investment in construction slowed down (+0.5% after +1.2%); it is mainly due to the downturn in civil engineering, as a consequence of the sharp increase in Q2 2017. Investment in buildings decreased a little over the past quarter.
GFCF in manufactured goods accelerated slightly (+0.8% after +0.5%), particularly in equipment goods. Investment in services remained dynamic, notably in information and communication (software publishing).
All in all, non-financial corporations investment rose again over the past quarter (+0.9% after +1.1%), as well as household investment (+1.1% after +1.4%).
In overhang for 2017, total investment accelerates (+3.3% after +2.7%).
tableauTab5 – Ratios of non-financial corporations' account
| 2016 Q4 | 2017 Q1 | 2017 Q2 | 2017 Q3 | 2016 | |
|---|---|---|---|---|---|
| Profit share | 31.7 | 31.6 | 31.8 | 31.8 | |
| Investment ratio | 23.4 | 23.7 | 23.8 | 23.3 | |
| Savings ratio | 19.6 | 19.9 | 20.0 | 19.6 | |
| Self-financing ratio | 83.7 | 83.7 | 84.1 | 84.2 |
- Source: INSEE
Foreign trade balance weighed down on GDP growth
In Q3 2017, imports recovered (+2.5% after +0.2%), in particular with purchases of transport equipment. At the same time, exports braked (+0.7% after +2.3%) as a result of a sharp deceleration in sales of manufactured goods (+0.5% after +2.9%). In particular, it fell back in transport equipment (−0.5% after +6.2%). All in all, foreign trade balance weighed down on GDP growth by −0.6 points after a contribution of +0.6 points in the previous quarter.
The contribution of changes in inventories to GDP growth was positive
In Q3 2017, changes in inventories contributed positively to GDP growth, by +0.5 points after −0.5 points. This increase is mainly due to transport equipment (notably aeronautic). Excluding this product, changes in inventories did not globally contribute to GDP growth in Q3 2017 (after −0.1 points in Q2 2017).
tableauTab6 – Expenditure, receipts and net borrowing of public administrations
| 2016 Q3 | 2016 Q4 | 2017 Q1 | 2017 Q2 | 2016 | |
|---|---|---|---|---|---|
| In billions of euros | |||||
| Total expenditure | 315.1 | 317.0 | 317.9 | 1256.9 | |
| Total receipts | 297.5 | 299.4 | 302.4 | 1181.1 | |
| Net lending (+) or borrowing (-) | -17.6 | -17.6 | -15.5 | -75.8 | |
| In % of GDP | |||||
| Net lending (+) or borrowing (-) | -3.1 | -3.1 | -2.7 | -3.4 |
- Source: INSEE
Revisions
GDP growth estimate for Q2 2017 is slightly revised upward (+0.1 points), in particular with the update of seasonal adjustment coefficients. The growth rate overhang in Q3 2017 now stands at +1.7%.