

 30 May 2017
2017- n° 140Household consumption expenditure on goods bounced back in April (+0.5%) Household consumption expenditure on goods - April 2017
30 May 2017
2017- n° 140Household consumption expenditure on goods bounced back in April (+0.5%) Household consumption expenditure on goods - April 2017
In April 2017, household expenditure on goods increased in volume* (+0.5%) after two months of decline. Expenses on energy bounced back and food consumption accelerated strongly. However, purchases of engineered goods fell back.
In April 2017, household expenditure on goods increased in volume* (+0.5%) after two months of decline. Expenses on energy bounced back and food consumption accelerated strongly. However, purchases of engineered goods fell back.

*Volumes are measured at chain-link previous year prices (2010 euro billions) and all figures are trading-day and seasonally adjusted.
graphiqueGraph1 – Total consumption of goods

- Source: INSEE
Energy: rebound
In April 2017, energy consumption recovered (+3.1%) after declining for two consecutive months. Expenses on gas and electricity increased sharply: indeed, temperatures got closer to their seasonal norm, after two months relatively warm for the season. However, consumption of refined products decreased anew (−1.9% after +0.9% in March), for all types of fuels (gasoline, diesel, liquefied petroleum gas).
graphiqueGraph2 – Breakdown of energy

- Source: INSEE
Food products: strong rise
In April 2017, consumption of food products sped up sharply (+0.9% after +0.1% in March). This growth affects almost all types of products: fruits and vegetables, meat, milk products, drinks, etc. Only the consumption of tobacco went down.
graphiqueGraph3 – Food products, engineered goods and energy

- Source: INSEE
Engineered goods: downturn
In April 2017, purchases of engineered goods fell back (−0.8% after a stability in March), particularly purchases of textile-clothing and household durables.
Durables: decline
In April, expenses on durables declined after two months of growth, in particular household durables, notably furniture and audiovisual equipment. Car purchases decreased slightly.
Textile-clothing: decreasing again
In April, expenses on textile-clothing decreased again (−2.1% after −1.9% in March), whether it be purchases of textile, clothes or shoes.
Other engineered goods: virtually stable
In April, purchases of other engineered goods were virtually stable (−0.1% after +0.5%). Expenses on hardware fell back noticeably, but purchases of perfumes increased.
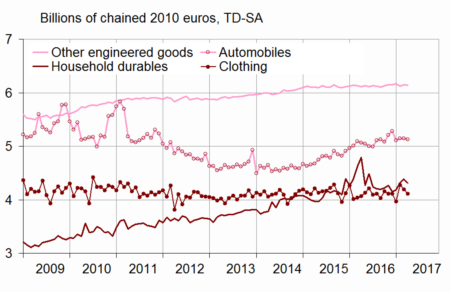
graphiqueGraph4 – Breakdown of engineered goods
- Source: INSEE
The variation in March 2017 is revised upwards
The variation of household expenditure on goods in March 2017 has been revised upwards by 0.3 points (−0.1% instead of −0.4%). However, the fall in the whole first quarter is unchanged (−0.4%). The magnitude of these revisions is usual at this time of the year. It comes from the benchmarking of the quarterly accounts on the annual accounts, revised for the years 2014 to 2016, from the reestimation of seasonal and trading day adjustment coefficients and calibration models, as well as from the integration of new information known since the last publication.
tableauTable – Household consumption expenditure on goods
| Weight (1) | Feb. 2017 | Mar. 2017 | Apr. 2017 | Apr. 17 / Apr. 16 | Q / Q-1 (2) | |
|---|---|---|---|---|---|---|
| Food products | 38 | 0.2 | 0.1 | 0.9 | 2.2 | 0.8 |
| - excl. Tobacco | 35 | –0.3 | 0.6 | 1.1 | 2.7 | 0.7 |
| Engineered goods | 45 | 2.2 | 0.0 | –0.8 | –1.0 | 0.9 |
| - Durables | 22 | 1.7 | 0.5 | –0.7 | –2.7 | 0.5 |
| Including : | ||||||
| - Automobiles | 12 | 0.9 | 0.0 | –0.4 | 1.3 | –1.1 |
| - Household durables | 8 | 3.3 | 1.5 | –1.8 | −10.0 | 3.3 |
| - Textile-clothing | 9 | 7.8 | –1.9 | –2.1 | 1.1 | 3.2 |
| - Other engineered goods | 13 | –0.6 | 0.5 | –0.1 | 0.5 | –0.2 |
| Energy | 17 | −10.5 | –0.7 | 3.1 | –4.8 | –7.6 |
| - Energy, water, waste | 10 | –16.3 | –2.0 | 7.1 | –8.1 | −11.5 |
| - Refined Products | 7 | –1.9 | 0.9 | –1.9 | –0.2 | –2.1 |
| Total | 100 | –0.9 | –0.1 | 0.5 | –0.5 | –0.7 |
| - Including Manufactured goods | 84 | 1.2 | –0.1 | –0.4 | 0.4 | 0.6 |
- (1) Weighting in the consumption expenditure on goods in value in 2016
- (2) Last three months / previous three months
- Source: INSEE
Documentation
Methodology (pdf,23 Ko)