

 9 August 2011
2011In July 2011, the prices of the imported commodities recovered Prices of oil and raw material imports - July 2011
9 August 2011
2011In July 2011, the prices of the imported commodities recovered Prices of oil and raw material imports - July 2011
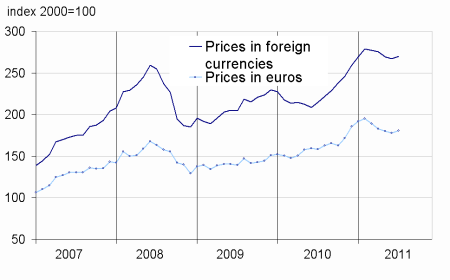
In July, the price of oil in dollars rebounded (+2.3%) after having declined sightly in June (-1,0%). It stood at $116.5 per barrel Brent. The foreign currency prices for non-energy commodities imported into France have also recovered (+1.6% after -0.4% in June).
Warning : the history of indexes of natural textiles fibers and soyeabean meal prices has been revised
In July, the price of oil in dollars rebounded (+2.3%) after having declined sightly in June (-1,0%). It stood at $116.5 per barrel Brent. The foreign currency prices for non-energy commodities imported into France have also recovered (+1.6% after -0.4% in June).
The price of oil recovered
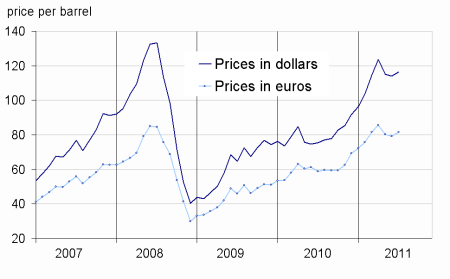
In July, the dollar price of oil from the North Sea (Brent) recovered (+2.3% after -1.0%). In euros, the rise in oil price was higher (+3.1% after -1.4% in June), due to the depreciation of European currency vis-à-vis the dollar (-0.8%). After rising rapidly earlier this year, the prices of oil has dropped over the last three months (-5.7% in dollars and -4.6% in euros).
The prices of industrial raw materials bounced
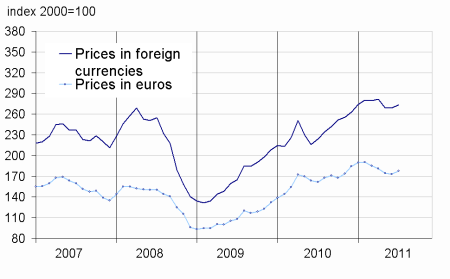
In July, the prices of industrial raw materials in foreign currencies have rebounded (+1.9% after -0.2%). On the one hand, the prices of mineral raw materials have risen (+2.0% after -0.5%). Among, the prices of nonferrous metals (+2.6% after -0.7%), the increases in the zinc (+7.3%), lead (+6.8%) and copper (+6.3%) were partially offset by lower prices of titanium (-2.0%) and aluminium (-1.7%). The prices of precious metals increased again (+3.8% after -0.6%), mainly those of silver (+5.9%) and gold (+2.9%).
On the other hand, the prices of agro-industrial raw materials have accelerated (+1.4% after +0.8% in June) due to the particular jump in prices of sawn timber of conifers (+8.9% after +2.2%). In contrast, the prices of natural textiles fibers have increased their fall (-15.3% after -7.2%) in the wake of cotton prices (-18.4% after -9.6%).
The prices of raw food materials recovered
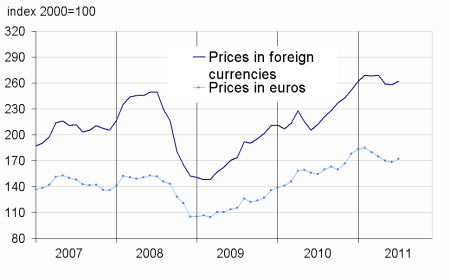
In July, the prices of raw food in foreign currencies have rebounded (+1.0% after -0.8%). The prices of tropical beverages rebounded (+1.9% after -3.7%), including tea prices (+8.4%) and cocoa (+4.5%) In contrast, the prices of imported cereals were down (-2.4% after +1.7%), due to a sustained fall in maize prices (-5.1%). Similarly, the prices of oilseeds continued to decline (-0.6% after -0.8% in June). Finally, the price of sugar has slowed (+13.1% after +19.3%).
tableautabpetrole – Oil and petroleum products
| Prices | Change (%) | |||
|---|---|---|---|---|
| Over the last month | over the last month | over the last 3 months | over the last 12 months | |
| Brent in $ per barrel | 116,5 | 2,3 | –5,7 | 54,6 |
| Brent in € per barrel | 81,6 | 3,1 | –4,6 | 38,5 |
| Gasoline | 1054,7 | 4,7 | –7,5 | 53,3 |
| Gas Oil | 968,9 | 2,9 | –5,3 | 51,7 |
| Heavy fuel | 633,1 | 4,0 | 0,3 | 56,6 |
| Naphta | 1038,6 | 0,0 | –1,3 | 67,7 |
- Prices are in dollars per tonne unless otherwise specified
- Source : INSEE
tableautabmatprem – Imported raw materials (excluding energy) in domestic currency
| Index | Changes (%) | |||
|---|---|---|---|---|
| Over the last month | over last month | over the last 3 months | over the last 12 months | |
| Food total | 269,7 | 1,0 | –2,1 | 25,6 |
| Tropical beverages | 292,6 | 1,9 | –3,1 | 19,3 |
| Oil seeds, vegetable oils | 288,5 | –0,6 | –1,6 | 25,8 |
| Cereals | 282,4 | –2,4 | –1,3 | 38,5 |
| Sugar | 361,8 | 13,1 | 15,9 | 67,2 |
| Beef meat | 158,7 | 1,6 | –5,7 | 18,7 |
| Industrial raw materials | 273,6 | 1,9 | –2,9 | 22,1 |
| Agricultural raw materials | 164,2 | 1,4 | –3,9 | 15,9 |
| Natural Fibers | 258,5 | –15,3 | –36,7 | 53,3 |
| Natural rubber | 551,2 | –0,9 | –8,7 | 46,6 |
| Hides | 106,9 | –0,8 | –2,9 | –7,7 |
| Wood pulp | 147,5 | –0,1 | 0,9 | 3,1 |
| Tropical wood | 159,4 | –0,5 | 1,9 | 10,1 |
| Sawn softwood | 98,3 | 8,9 | –3,7 | 17,7 |
| Minerals | 332,7 | 2,0 | –2,6 | 24,3 |
| Iron ore | 615,1 | –1,2 | –1,2 | –13,6 |
| Non-ferrous metals | 293,2 | 2,6 | –3,0 | 31,5 |
| Precious metals | 460,0 | 3,8 | –2,5 | 56,2 |
| All commodities | 261,9 | 1,6 | –2,6 | 23,3 |
- Source : INSEE
graphiqueG_petrole_ang – Oil
graphiqueG_alim_ang – Food
- Source : INSEE
- Source : INSEE
graphiqueG_ensemble_ang – All commodities
- Source : INSEE
graphiqueG_indus_ang – Industrial raw materials
- Source : INSEE
Pour en savoir plus
Time series : Raw materials prices