

 14 August 2015
2015- n° 195In Q2 2015, French GDP was stable Quarterly national accounts - second estimate - 2nd quarter 2015
14 August 2015
2015- n° 195In Q2 2015, French GDP was stable Quarterly national accounts - second estimate - 2nd quarter 2015
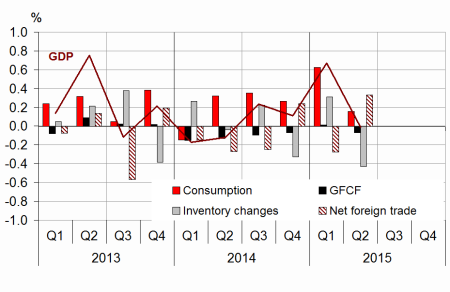
In Q2 2015, GDP in volume terms* was stable: 0.0% after +0.7% in Q1 2015.
In Q2 2015, GDP in volume terms* was stable: 0.0% after +0.7% in Q1 2015.
Household consumption expenditure decelerated sharply (+0.1% after +0.9%) while their total gross fixed capital formation (GFCF) decreased again (–1.6% after –1.1%). Non-financial corporations and general government investment also slowed down. Overall, total domestic demand (excluding inventory changes) decelerated strongly: it contributed for +0.1 points to GDP growth (after +0.6 points in Q1 2015).
Imports slowed (+0.6% after +2.2%) while exports accelerated (+1.7% after 1.3%). All in all, the foreign trade balance contributed positively to GDP growth (+0.3 points after –0.3 points). Conversely, changes in inventories contributed negatively: –0.4 points after +0.3 points in the previous quarter.
Total production was almost stable
In Q2 2015, production in goods and services was almost stable (–0.1% after +0.8%). Output in the manufactured goods decreased strongly (–0.7% after +1.3%), notably in coke and refined petroleum (–9.6% after +6.5%) due to some refineries shutdowns, and in transport equipment (–1.3% after +5.5%). In contrast, production in equipment goods recovered (+2.1% after –2.1%). Production in tradable services kept rising but at a slower rate (+0.3% after +0.8%) and output in construction shrank again (–1.1% after –0.8%).
Households’ consumption decelerated strongly
In Q2 2015, households’ consumption expenditure decelerated strongly (+0.1% after +0.9%). Expenditure on energy-water-waste stepped back (–2.2% after +3.7%), particularly in electricity and gas. Consumption in engineered goods declined (–0.1% after +1.7%), notably in clothing and pharmaceutical expenditure. Otherwise, consumption in services increased moderately (+0.2% after +0.3%).

* This growth rate is seasonally and working-day adjusted; volumes are chain-linked previous-year-prices volumes.
graphiqueGraph1 – GDP and its main components
tableauTab1 – Goods and services:supply and uses chain-linked volumes
| 2014 Q3 | 2014 Q4 | 2015 Q1 | 2015 Q2 | 2014 | 2015 (ovhg) | |
|---|---|---|---|---|---|---|
| GDP | 0.2 | 0.1 | 0.7 | 0.0 | 0.2 | 0.8 |
| Imports | 1.8 | 1.8 | 2.2 | 0.6 | 3.9 | 5.1 |
| Household consumption *expenditure | 0.4 | 0.2 | 0.9 | 0.1 | 0.6 | 1.5 |
| General government's *consumption expenditure | 0.5 | 0.5 | 0.5 | 0.3 | 1.5 | 1.5 |
| GFCF | -0.4 | -0.3 | 0.0 | -0.3 | -1.2 | -0.8 |
| *of which Non-financial corporated and unincorporated enterprises | 0.3 | 0.0 | 0.6 | 0.2 | 2.0 | 0.9 |
| Households | -1.1 | -0.8 | -1.2 | -1.6 | -5.3 | -3.9 |
| General government | -2.4 | -0.7 | 0.2 | -0.1 | -6.9 | -2.2 |
| Exports | 1.0 | 2.8 | 1.3 | 1.7 | 2.4 | 5.3 |
| Contributions : | ||||||
| Internal demand excluding inventory changes | 0.3 | 0.2 | 0.6 | 0.1 | 0.5 | 1.0 |
| Inventory changes | 0.2 | -0.3 | 0.3 | -0.4 | 0.2 | -0.1 |
| Net foreign trade | -0.2 | 0.2 | -0.3 | 0.3 | -0.5 | -0.1 |
tableauTab2 – Sectoral accounts
| 2014 Q3 | 2014 Q4 | 2015 Q1 | 2015 Q2 | 2014 | 2015 (ovhg) | |
|---|---|---|---|---|---|---|
| Profit ratio of NFC* (level) | 29.4 | 29.8 | 31.1 | 29.5 | ||
| Household purchasing power | 0.5 | 0.0 | 1.2 | 1.1 | 1.5 |
- *NFC: non-financial corporations
tableauTab3 – Production, Consumption and GFCF: main components
| 2014 Q3 | 2014 Q4 | 2015 Q1 | 2015 Q2 | 2014 | 2015 (ovhg) | |
|---|---|---|---|---|---|---|
| Production of branches | 0.4 | 0.1 | 0.8 | -0.1 | 0.7 | 1.0 |
| Goods | 0.8 | -0.2 | 1.5 | -0.9 | 0.1 | 1.0 |
| Manufactured Industry | 0.6 | 0.2 | 1.3 | -0.7 | 0.3 | 1.0 |
| Construction | -0.8 | -0.7 | -0.8 | -1.1 | -2.2 | -2.9 |
| Market services | 0.5 | 0.4 | 0.8 | 0.3 | 1.2 | 1.6 |
| Non-market services | 0.3 | 0.3 | 0.4 | 0.3 | 1.3 | 1.1 |
| Household consumption | 0.4 | 0.2 | 0.9 | 0.1 | 0.6 | 1.5 |
| Food products | -0.2 | 0.4 | 0.2 | 0.8 | 0.2 | 1.1 |
| Energy | 0.7 | -1.7 | 3.7 | -2.2 | -5.7 | 1.6 |
| Engineered goods | 0.5 | 0.5 | 1.7 | -0.1 | 1.9 | 2.2 |
| Services | 0.2 | 0.1 | 0.3 | 0.2 | 0.7 | 0.7 |
| GFCF | -0.4 | -0.3 | 0.0 | -0.3 | -1.2 | -0.8 |
| Manufactured goods | 0.2 | -0.2 | 1.2 | 0.1 | 1.3 | 1.1 |
| Construction | -1.2 | -0.7 | -1.1 | -1.3 | -3.4 | -3.5 |
| Market services | 0.2 | 0.2 | 0.9 | 0.7 | 0.4 | 1.8 |
tableauTab4 – Households’ disposable income and ratios of households’ account
| 2014 Q3 | 2014 Q4 | 2015 Q1 | 2015 Q2 | 2014 | 2015 (ovhg) | |
|---|---|---|---|---|---|---|
| HDI | 0.4 | -0.1 | 1.1 | 1.1 | 1.3 | |
| Household purchasing power | 0.5 | 0.0 | 1.2 | 1.1 | 1.5 | |
| HDI by cu* (purchasing power) | 0.4 | -0.1 | 1.1 | 0.7 | 1.3 | |
| Adjusted HDI (purchasing power) | 0.5 | 0.1 | 1.0 | 1.3 | 1.5 | |
| Saving rate (level) | 15.2 | 15.0 | 15.2 | 15.1 | ||
| Financial saving rate (level) | 6.2 | 6.0 | 6.3 | 6.0 |
- *cu: consumption unit
tableauTab5 – Ratios of non-financial corporations’ account
| 2014 Q3 | 2014 Q4 | 2015 Q1 | 2015 Q2 | 2014 | |
|---|---|---|---|---|---|
| Profit share | 29.4 | 29.8 | 31.1 | 29.5 | |
| Investment ratio | 23.2 | 23.0 | 22.7 | 23.1 | |
| Savings ratio | 17.4 | 18.3 | 19.2 | 17.4 | |
| Self-financing ratio | 75.0 | 79.9 | 84.6 | 75.2 |
tableauTab6 – Expenditure, receipts and net borrowing of public administrations
| 2014 Q3 | 2014 Q4 | 2015 Q1 | 2015 Q2 | 2014 | |
|---|---|---|---|---|---|
| In billions of euros | |||||
| Total expenditure | 306.9 | 307.5 | 309.9 | 1226.5 | |
| Total receipts | 285.6 | 286.3 | 288.9 | 1141.7 | |
| Net lending (+) or borrowing (-) | -21.4 | -21.1 | -21.0 | -84.9 | |
| In % of GDP | |||||
| Net lending (+) or borrowing (-) | -4.0 | -3.9 | -3.9 | -4.0 |
Households’ investment decreased again, non-financial corporations’ grew very weakly
Total GFCF declined in Q2 2015 (–0.3% after 0.0%). Investment in construction decreased for the eighth consecutive quarter (–1.3% after –1.1%). Excluding construction, GFCF increased (+0.4% after +1.0%). Investment in manufactured goods decelerated (+0.1% after +1.2%). Expenses in market services kept rising (+0.7% after +0.9%). Non-financial corporations’ GFCF slowed down (+0.2% after +0.6%), general government’s declined slightly (–0.1% after +0.2%). The decrease in households’ GFCF worsened (–1.6% after –1.2%).
Exports were in upward trend
In Q2 2015, exports accelerated (+1.7% after +1.3%), especially in transport equipment (+8.2% after +0.1%). Conversely, exports in coke and refined petroleum products stepped back sharply (–7.5% after +13.0%).
At the same time imports decelerated (+0.6% after +2.2%), notably due to a strong decrease in expenditures on unrefined petroleum products and the slowdown in transport equipment (+4.1% after +5.5%). Thus, foreign trade drove activity this quarter (+0.3 points to GDP after –0.3 points).
Changes in inventories weighed down on activity
Changes in inventories accounted for –0.4 points to GDP growth this quarter, after +0.3 points. The negative contribution concerned mostly transport equipment and refined petroleum.
Revisions
In Q2 the growth rate of GDP is slightly upscaled (from +0.6% to +0.7%) compared to the previous release.
Pour en savoir plus
Time series : Operations on goods and services
Time series : Gross domestic product balance
Time series : Institutional sector accounts
Time series : Branch accounts